JetBlue Airlines 2005 Annual Report Download - page 43
Download and view the complete annual report
Please find page 43 of the 2005 JetBlue Airlines annual report below. You can navigate through the pages in the report by either clicking on the pages listed below, or by using the keyword search tool below to find specific information within the annual report.-
 1
1 -
2
-
3
-
4
-
5
-
6
-
7
-
8
-
9
-
10
-
11
-
12
-
13
-
14
-
15
-
16
-
17
-
18
-
19
-
20
-
21
-
22
-
23
-
24
-
25
-
26
-
27
-
28
-
29
-
30
-
31
-
32
-
 33
33 -
 34
34 -
 35
35 -
 36
36 -
 37
37 -
 38
38 -
 39
39 -
 40
40 -
 41
41 -
 42
42 -
 43
43 -
 44
44 -
 45
45 -
 46
46 -
 47
47 -
 48
48 -
 49
49 -
 50
50 -
 51
51 -
 52
52 -
 53
53 -
54
-
55
-
56
-
57
-
58
-
59
-
60
-
61
-
62
-
63
-
64
-
65
-
66
-
67
-
68
-
69
-
70
-
71
-
72
-
73
-
74
-
75
-
76
-
77
-
78
-
79
-
80
-
81
-
82
-
83
-
84
-
85
-
86
-
87
-
88
-
89
-
90
-
91
-
92
-
93
-
94
-
95
-
96
-
97
-
98
-
99
-
100
 |
 |

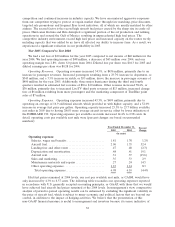
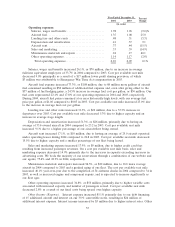
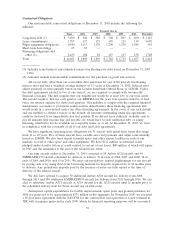
Year Ended December 31, Percent
Change2004 2003
(in cents)
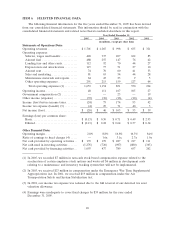
Operating expenses:
Salaries, wages and benefits .......................... 1.78 1.96 (9.0)%
Aircraft fuel ........................................ 1.35 1.08 25.0
Landing fees and other rents ......................... .48 .51 (5.3)
Depreciation and amortization........................ .41 .37 9.1
Aircraft rent........................................ .37 .44 (15.5)
Sales and marketing ................................. .33 .39 (14.9)
Maintenance materials and repairs .................... .24 .17 40.1
Other operating expenses ............................ 1.14 1.17 (2.8)
Total operating expenses ........................... 6.10 6.09 0.1%
Salaries, wages and benefits increased 26.1%, or $70 million, due to an increase in average
full-time equivalent employees of 33.7%in 2004 compared to 2003. Cost per available seat mile
decreased 9.0%principally as a result of a $17 million lower profit sharing provision, of which
$3 million was attributable to Emergency War Time Act compensation in 2003.
Aircraft fuel expense increased 73.3%, or $108 million, due to 68 million more gallons of aircraft
fuel consumed resulting in $58 million of additional fuel expense and, even after giving effect to the
$37 million of fuel hedging gains, a 24.5%increase in average fuel cost per gallon, or $50 million. Our
fuel costs represented 22.1%and 17.8%of our operating expenses in 2004 and 2003, respectively.
During 2004, aircraft fuel prices remained at or near historically high levels, with our average fuel
price per gallon at $1.06 compared to $0.85 in 2003. Cost per available seat mile increased 25.0%due
to the increase in average fuel cost per gallon.
Landing fees and other rents increased 31.3%, or $22 million, due to a 35.3%increase in
departures over 2003. Cost per available seat mile decreased 5.3%due to higher capacity and an
increase in average stage length.
Depreciation and amortization increased 51.3%, or $26 million, primarily due to having an
average of 35.6 owned aircraft in 2004 compared to 23.2 in 2003. Cost per available seat mile
increased 9.1%due to a higher percentage of our aircraft fleet being owned.
Aircraft rent increased 17.1%, or $10 million, due to having an average of 25.0 aircraft operated
under operating leases during 2004 compared to 20.8 in 2003. Cost per available seat mile decreased
15.5%due to higher capacity and a smaller percentage of our fleet being leased.
Sales and marketing expense increased 17.9%, or $9 million, due to higher credit card fees
resulting from increased passenger revenues. On a cost per available seat mile basis, sales and
marketing expense decreased 14.9%primarily due to the increases in capacity exceeding increases in
advertising costs. We book the majority of our reservations through a combination of our website and
our agents, 75.4%and 22.9%in 2004, respectively.
Maintenance materials and repairs increased 94.3%, or $22 million, due to 16.6 more average
aircraft in 2004 compared to 2003 and a gradual aging of our fleet. The cost per available seat mile
increased 40.1%year-over-year due to the completion of 54 airframe checks in 2004 compared to 34 in
2003, as well as increased engine and component repairs, and is expected to increase significantly as
our fleet ages.
Other operating expenses increased 34.8%, or $56 million, primarily due to higher variable costs
associated with increased capacity and number of passengers served. Cost per available seat mile
decreased 2.8%as a result of our fixed costs being spread over higher capacity.
Other Income (Expense). Interest expense increased 85.1%primarily due to our debt financing
of 15 additional aircraft and interest on our 3
1
⁄
2
%convertible notes, resulting in $24 million of
additional interest expense. Interest income increased by $3 million due to higher interest rates. Other
35