JetBlue Airlines 2005 Annual Report Download - page 35
Download and view the complete annual report
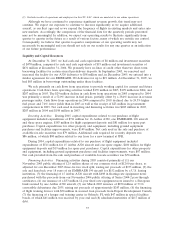
Please find page 35 of the 2005 JetBlue Airlines annual report below. You can navigate through the pages in the report by either clicking on the pages listed below, or by using the keyword search tool below to find specific information within the annual report.-
 1
1 -
2
-
3
-
4
-
5
-
6
-
7
-
8
-
9
-
10
-
11
-
12
-
13
-
14
-
15
-
16
-
17
-
18
-
19
-
20
-
21
-
22
-
23
-
24
-
 25
25 -
 26
26 -
 27
27 -
 28
28 -
 29
29 -
 30
30 -
 31
31 -
 32
32 -
 33
33 -
 34
34 -
 35
35 -
 36
36 -
 37
37 -
 38
38 -
 39
39 -
 40
40 -
 41
41 -
 42
42 -
 43
43 -
 44
44 -
 45
45 -
46
-
47
-
48
-
49
-
50
-
51
-
52
-
53
-
54
-
55
-
56
-
57
-
58
-
59
-
60
-
61
-
62
-
63
-
64
-
65
-
66
-
67
-
68
-
69
-
70
-
71
-
72
-
73
-
74
-
75
-
76
-
77
-
78
-
79
-
80
-
81
-
82
-
83
-
84
-
85
-
86
-
87
-
88
-
89
-
90
-
91
-
92
-
93
-
94
-
95
-
96
-
97
-
98
-
99
-
100
 |
 |

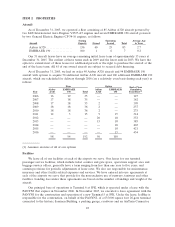
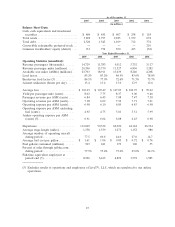
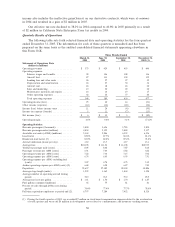
As of December 31,
2005 2004 2003 2002 2001
(in millions)
Balance Sheet Data:
Cash, cash equivalents and investment
securities ............................ $ 484 $ 450 $ 607 $ 258 $ 118
Total assets ............................ 3,892 2,797 2,185 1,379 674
Total debt ............................. 2,326 1,545 1,109 712 374
Convertible redeemable preferred stock . . . — — — — 210
Common stockholders’ equity (deficit) .... 911 754 670 415 (32)
Year Ended December 31,
2005 2004 2003 2002 2001
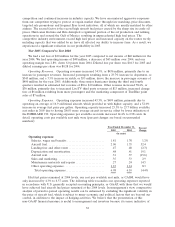
Operating Statistics (unaudited):
Revenue passengers (thousands) ....... 14,729 11,783 9,012 5,752 3,117
Revenue passenger miles (millions)..... 20,200 15,730 11,527 6,836 3,282
Available seat miles (ASMs) (millions) . 23,703 18,911 13,639 8,240 4,208
Load factor.......................... 85.2%83.2%84.5%83.0%78.0%
Breakeven load factor (5) ............. 86.1%77.9%72.6%71.5%73.7%
Aircraft utilization (hours per day) ..... 13.4 13.4 13.0 12.9 12.6
Average fare ........................ $ 110.03 $ 103.49 $ 107.09 $ 106.95 $ 99.62
Yield per passenger mile (cents) ....... 8.02 7.75 8.37 9.00 9.46
Passenger revenue per ASM (cents) .... 6.84 6.45 7.08 7.47 7.38
Operating revenue per ASM (cents) .... 7.18 6.69 7.32 7.71 7.61
Operating expense per ASM (cents) .... 6.98 6.10 6.09 6.43 6.98
Operating expense per ASM, excluding
fuel (cents) ........................ 4.92 4.75 5.01 5.51 5.99
Airline operating expense per ASM
(cents) (5) ......................... 6.91 6.04 6.08 6.43 6.98
Departures .......................... 112,009 90,532 66,920 44,144 26,334
Average stage length (miles)........... 1,358 1,339 1,272 1,152 986
Average number of operating aircraft
during period...................... 77.5 60.6 44.0 27.0 14.7
Average fuel cost per gallon ........... $ 1.61 $ 1.06 $ 0.85 $ 0.72 $ 0.76
Fuel gallons consumed (millions) ....... 303 241 173 106 55
Percent of sales through jetblue.com
during period...................... 77.5%75.4%73.0%63.0%44.1%
Full-time equivalent employees at
period end (5) ..................... 8,326 6,413 4,892 3,572 1,983
(5) Excludes results of operations and employees of LiveTV, LLC, which are unrelated to our airline
operations.
27