JetBlue Airlines 2005 Annual Report Download - page 41
Download and view the complete annual report
Please find page 41 of the 2005 JetBlue Airlines annual report below. You can navigate through the pages in the report by either clicking on the pages listed below, or by using the keyword search tool below to find specific information within the annual report.-
 1
1 -
2
-
3
-
4
-
5
-
6
-
7
-
8
-
9
-
10
-
11
-
12
-
13
-
14
-
15
-
16
-
17
-
18
-
19
-
20
-
21
-
22
-
23
-
24
-
25
-
26
-
27
-
28
-
29
-
30
-
 31
31 -
 32
32 -
 33
33 -
 34
34 -
 35
35 -
 36
36 -
 37
37 -
 38
38 -
 39
39 -
 40
40 -
 41
41 -
 42
42 -
 43
43 -
 44
44 -
 45
45 -
 46
46 -
 47
47 -
 48
48 -
 49
49 -
 50
50 -
 51
51 -
52
-
53
-
54
-
55
-
56
-
57
-
58
-
59
-
60
-
61
-
62
-
63
-
64
-
65
-
66
-
67
-
68
-
69
-
70
-
71
-
72
-
73
-
74
-
75
-
76
-
77
-
78
-
79
-
80
-
81
-
82
-
83
-
84
-
85
-
86
-
87
-
88
-
89
-
90
-
91
-
92
-
93
-
94
-
95
-
96
-
97
-
98
-
99
-
100
 |
 |

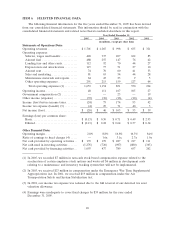
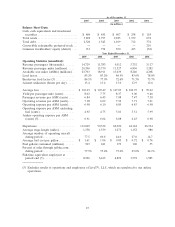
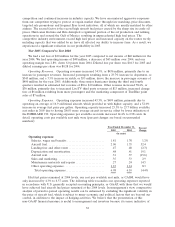
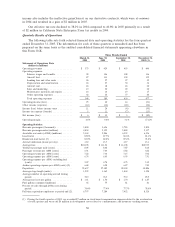
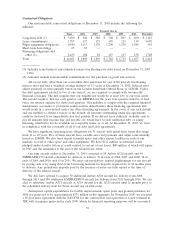
our ability to manage our costs and also assists in understanding the significant impact that fuel prices
have had on our operations. Investors should consider these non-GAAP financial measures in addition
to, and not as a substitute for, our financial performance measures prepared in accordance with
GAAP.
Year Ended December 31, 2005
$ CASM
(in millions) (in cents)
Operating expenses as reported .................... $ 1,653 6.98
Less: Reported aircraft fuel........................ (488) (2.06)
Add: Aircraft fuel at 2004 cost per gallon ........... 321 1.36
Profit sharing impact.............................. 21 0.09
Fuel neutral operating expenses .................... $ 1,507 6.37
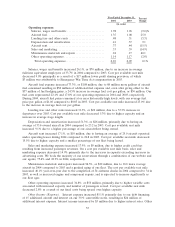
Salaries, wages and benefits increased 26.8%, or $91 million, due primarily to an increase in
average full-time equivalent employees of 27.3%in 2005 compared to 2004. We did not record any
profit sharing in 2005 compared to $14 million in 2004. This decrease was partially offset by the
incurrence of $7 million in non-cash stock-based compensation expense related to the accelerated
vesting of 19.9 million stock options in December 2005. The decision to accelerate the vesting of these
options was made primarily to avoid recognizing related compensation costs in future consolidated
financial statements upon our adoption of SFAS No. 123(R) in January 2006. All other terms and
conditions applicable to such options, including the exercise prices, remain unchanged. Following the
acceleration, 28.4 million, or 91.4%, of our outstanding options were vested. Cost per available seat
mile remained relatively flat as a result of higher wages being offset by lower profit sharing.
Aircraft fuel expense increased 91.1%, or $233 million, due to 62 million more gallons of aircraft
fuel consumed resulting in $66 million of additional fuel expense and, even after giving effect to
$43 million of fuel hedging gains, a 52.0%increase in average fuel cost per gallon, or $167 million.
Our fuel costs represented 29.5%and 22.1%of our operating expenses in 2005 and 2004, respectively.
During 2005, aircraft fuel prices remained at historically high levels, with our average fuel price per
gallon at $1.61 compared to $1.06 in 2004. Based on our expected fuel volume for 2006, a $0.10 per
gallon increase in the cost of aircraft fuel would increase our annual fuel expense by approximately
$40 million. Cost per available seat mile increased 52.4%due to the increase in average fuel cost per
gallon.
Landing fees and other rents increased 22.5%, or $20 million, due to a 23.7%increase in
departures over 2004 offset by lower landing fee rates. Cost per available seat mile decreased 2.3%
due to higher capacity and an increase in average stage length. Landing fees and other rents are
expected to increase approximately $10 million in 2006 as a result of ground rent on our new terminal
at JFK, which is under construction.
Depreciation and amortization increased 49.3%, or $38 million, primarily due to having an
average of 51.9 owned aircraft in 2005 compared to 35.6 in 2004. Cost per available seat mile
increased 19.1%due to a higher percentage of our aircraft fleet being owned and as a result of placing
into service our new hangars and training center during 2005.
Aircraft rent increased 5.7%, or $4 million, due to $2 million in higher rates and $2 million
related to new aircraft leases. Cost per available seat mile decreased 15.6%due to higher capacity and
a lower percentage of our fleet being leased.
Sales and marketing expense increased 28.9%, or $18 million, due to higher credit card fees
resulting from increased passenger revenues. On a cost per available seat mile basis, sales and
marketing expense increased 2.9%primarily due to higher credit card fees resulting from higher
average fares. We book all of our reservations through a combination of our website and our agents
(77.5%and 22.5%in 2005, respectively).
Maintenance materials and repairs increased 43.5%, or $19 million, due to 16.9 more average
aircraft in 2005 compared to 2004 and a gradual aging of our fleet. Cost per available seat mile
33