JetBlue Airlines 2005 Annual Report Download - page 44
Download and view the complete annual report
Please find page 44 of the 2005 JetBlue Airlines annual report below. You can navigate through the pages in the report by either clicking on the pages listed below, or by using the keyword search tool below to find specific information within the annual report.-
 1
1 -
2
-
3
-
4
-
5
-
6
-
7
-
8
-
9
-
10
-
11
-
12
-
13
-
14
-
15
-
16
-
17
-
18
-
19
-
20
-
21
-
22
-
23
-
24
-
25
-
26
-
27
-
28
-
29
-
30
-
31
-
32
-
33
-
 34
34 -
 35
35 -
 36
36 -
 37
37 -
 38
38 -
 39
39 -
 40
40 -
 41
41 -
 42
42 -
 43
43 -
 44
44 -
 45
45 -
 46
46 -
 47
47 -
 48
48 -
 49
49 -
 50
50 -
 51
51 -
 52
52 -
 53
53 -
 54
54 -
55
-
56
-
57
-
58
-
59
-
60
-
61
-
62
-
63
-
64
-
65
-
66
-
67
-
68
-
69
-
70
-
71
-
72
-
73
-
74
-
75
-
76
-
77
-
78
-
79
-
80
-
81
-
82
-
83
-
84
-
85
-
86
-
87
-
88
-
89
-
90
-
91
-
92
-
93
-
94
-
95
-
96
-
97
-
98
-
99
-
100
 |
 |

income also includes the ineffective gains(losses) on our derivative contracts, which were de minimis
in 2004 and resulted in a gain of $2 million in 2003.
Our effective tax rate declined to 38.2%in 2004 compared to 40.8%in 2003 primarily as a result
of $2 million in California State Enterprise Zone tax credits in 2004.
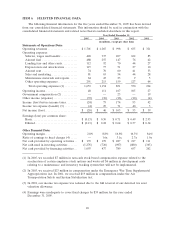
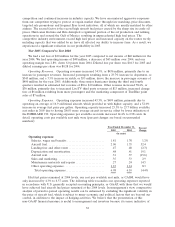
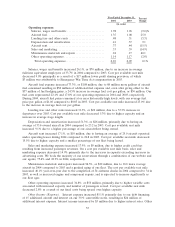
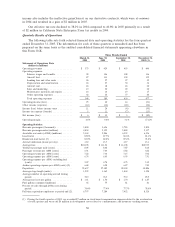
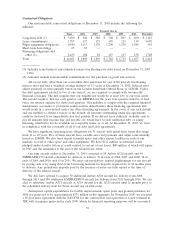
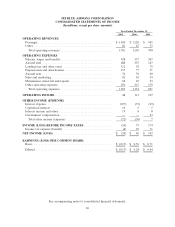
Quarterly Results of Operations
The following table sets forth selected financial data and operating statistics for the four quarters
ended December 31, 2005. The information for each of these quarters is unaudited and has been
prepared on the same basis as the audited consolidated financial statements appearing elsewhere in
this Form 10-K.
Three Months Ended
March 31,
2005 June 30,
2005 September 30,
2005 December 31,
2005 (1)
Statements of Operations Data
(dollars in millions)
Operating revenues ..................... $ 373 $ 429 $ 453 $ 446
Operating expenses:
Salaries, wages and benefits ............ 98 106 108 116
Aircraft fuel....................... 87 111 138 152
Landing fees and other rents ........... 26 27 27 32
Depreciation and amortization .......... 24 27 30 34
Aircraft rent....................... 18 18 18 20
Sales and marketing ................. 19 20 22 20
Maintenance materials and repairs ....... 14 14 19 17
Other operating expenses ............. 62 66 77 86
Total operating expenses .............. 348 389 439 477
Operating income (loss).................. 25 40 14 (31)
Other income (expense).................. (14) (16) (18) (24)
Income (loss) before income taxes .......... 11 24 (4) (55)
Income tax expense (benefit) .............. 5 11 (7) (13)
Net income (loss) ...................... $ 6 $ 13 $ 3 $ (42)
Operating margin ...................... 6.6%9.4%3.1%(7.1)%
Operating Statistics:
Revenue passengers (thousands)............ 3,400 3,696 3,783 3,850
Revenue passenger miles (millions).......... 4,434 5,125 5,484 5,157
Available seat miles (ASMs) (millions) ....... 5,169 5,846 6,332 6,356
Load factor .......................... 85.8%87.7%86.6%81.1%
Breakeven load factor (2) ................ 83.0%82.0%87.4%91.0%
Aircraft utilization (hours per day) .......... 13.2 13.7 13.7 13.1
Average fare.......................... $104.98 $ 111.26 $ 114.08 $109.33
Yield per passenger mile (cents) ............ 8.05 8.02 7.87 8.16
Passenger revenue per ASM (cents) ......... 6.91 7.03 6.82 6.62
Operating revenue per ASM (cents) ......... 7.22 7.34 7.15 7.02
Operating expense per ASM (cents) ......... 6.74 6.65 6.93 7.51
Operating expense per ASM, excluding fuel
(cents) ............................ 5.07 4.74 4.75 5.12
Airline operating expense per ASM (cents) (2) . 6.68 6.58 6.87 7.43
Departures ........................... 25,637 27,382 28,104 30,886
Average stage length (miles) .............. 1,292 1,369 1,444 1,324
Average number of operating aircraft during
period............................. 70.9 74.3 79.2 85.5
Average fuel cost per gallon ............... $ 1.31 $ 1.50 $ 1.70 $ 1.87
Fuel gallons consumed (millions) ........... 66 75 81 81
Percent of sales through jetblue.com during
period............................. 76.4%77.4%77.7%78.6%
Full-time equivalent employees at period end (2). 6,797 7,284 7,452 8,326
(1) During the fourth quarter of 2005, we recorded $7 million in stock-based compensation expense related to the acceleration
of stock options and wrote off $6 million in development costs related to a maintenance and inventory tracking system.
36