JetBlue Airlines 2005 Annual Report Download - page 37
Download and view the complete annual report
Please find page 37 of the 2005 JetBlue Airlines annual report below. You can navigate through the pages in the report by either clicking on the pages listed below, or by using the keyword search tool below to find specific information within the annual report.-
 1
1 -
2
-
3
-
4
-
5
-
6
-
7
-
8
-
9
-
10
-
11
-
12
-
13
-
14
-
15
-
16
-
17
-
18
-
19
-
20
-
21
-
22
-
23
-
24
-
25
-
26
-
 27
27 -
 28
28 -
 29
29 -
 30
30 -
 31
31 -
 32
32 -
 33
33 -
 34
34 -
 35
35 -
 36
36 -
 37
37 -
 38
38 -
 39
39 -
 40
40 -
 41
41 -
 42
42 -
 43
43 -
 44
44 -
 45
45 -
 46
46 -
 47
47 -
48
-
49
-
50
-
51
-
52
-
53
-
54
-
55
-
56
-
57
-
58
-
59
-
60
-
61
-
62
-
63
-
64
-
65
-
66
-
67
-
68
-
69
-
70
-
71
-
72
-
73
-
74
-
75
-
76
-
77
-
78
-
79
-
80
-
81
-
82
-
83
-
84
-
85
-
86
-
87
-
88
-
89
-
90
-
91
-
92
-
93
-
94
-
95
-
96
-
97
-
98
-
99
-
100
 |
 |

ITEM 7. MANAGEMENT’S DISCUSSION AND ANALYSIS OF FINANCIAL CONDITION
AND RESULTS OF OPERATIONS
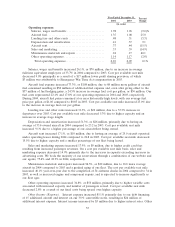
Overview
We are a low-fare, low-cost passenger airline that provides high-quality customer service primarily
on point-to-point routes. We offer our customers a differentiated product, with new aircraft, low fares,
leather seats, up to 36 channels of free LiveTV and movie selections from FOX InFlight at every seat,
pre-assigned seating and reliable performance. We focus on serving markets that previously were
underserved and/or metropolitan areas that have had high average fares. We currently serve 34
destinations in 15 states, Puerto Rico, the Dominican Republic and The Bahamas, and intend to
maintain a disciplined growth strategy. As of December 31, 2005, we operated 395 flights a day with a
fleet of 85 Airbus A320 aircraft and seven EMBRAER 190 aircraft. We are committed to operating
our scheduled flights whenever possible, as we believe our customers highly value completion rate.
Although we delivered a 99.2%completion rate, this philosophy, along with operating at three of the
most congested and delay-prone domestic airports, contributed to a 71.4%on-time performance in
2005, a decrease of 10.2 points from 2004, which was lower than all but one major U.S. airline.
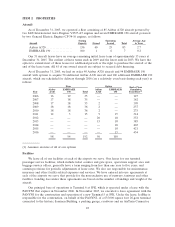
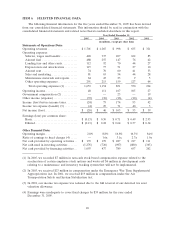
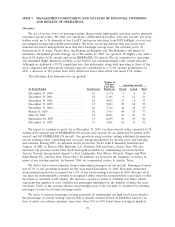
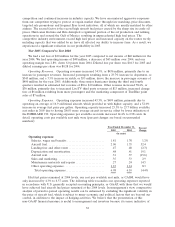
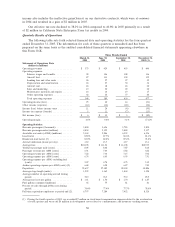
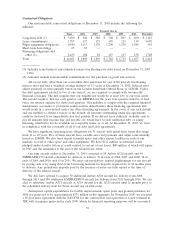
The following chart demonstrates our growth:
At Period Ended Destinations
Number of
Full and
Part-Time
Employees
Operating Aircraft
Owned Leased Total
December 31, 2000 ..................... 12 1,174 4 6 10
December 31, 2001 ..................... 18 2,361 9 12 21
December 31, 2002 ..................... 20 4,011 21 16 37
December 31, 2003 ..................... 21 5,433 29 24 53
December 31, 2004 ..................... 30 7,211 44 25 69
March 31, 2005 ......................... 30 7,511 48 25 73
June 30, 2005 .......................... 33 8,051 52 25 77
September 30, 2005 ..................... 33 8,439 56 25 81
December 31, 2005 ..................... 33 9,021 61 31 92
We expect to continue to grow. As of December 31, 2005, our firm aircraft orders consisted of 98
Airbus A320 aircraft and 94 EMBRAER 190 aircraft, plus options for an additional 50 Airbus A320
aircraft and 100 EMBRAER 190 aircraft. Our growth strategy involves adding additional frequencies
on our existing routes, connecting new city pairs among destinations we already serve and entering
new markets. During 2005, we initiated service from New York’s John F. Kennedy International
Airport, or JFK, to Boston, MA, Burbank, CA, Portland, OR and Ponce, Puerto Rico. We also
increased our presence in the New York metropolitan market by commencing service from New
Jersey’s Newark International Airport to Fort Lauderdale, Fort Myers, Orlando, Tampa and West
Palm Beach, FL, and San Juan, Puerto Rico. In addition, we increased the frequency of service in
many of our existing markets. In January 2006, we commenced service to Austin, Texas.
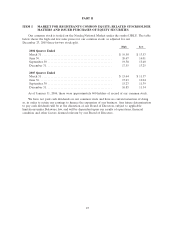
We derive our revenue primarily from transporting passengers on our aircraft. Passenger revenue
was 95.3%of our operating revenues for the year ended December 31, 2005. Revenues generated
from international routes accounted for 1.6%of our total passenger revenues in 2005. Because all of
our fares are nonrefundable, revenue is recognized either when the transportation is provided or after
the ticket or customer credit expires. We measure capacity in terms of available seat miles, which
represents the number of seats available for passengers multiplied by the number of miles the seats
are flown. Yield, or the average amount one passenger pays to fly one mile, is calculated by dividing
passenger revenue by revenue passenger miles.
We strive to increase passenger revenue primarily by maintaining our high load factor, which is
the percentage of aircraft seating capacity that is actually utilized. Based on published fares at our
time of entry, our advance purchase fares were often 30%to 40%below those existing in markets
29