JetBlue Airlines 2005 Annual Report Download - page 34
Download and view the complete annual report
Please find page 34 of the 2005 JetBlue Airlines annual report below. You can navigate through the pages in the report by either clicking on the pages listed below, or by using the keyword search tool below to find specific information within the annual report.-
 1
1 -
2
-
3
-
4
-
5
-
6
-
7
-
8
-
9
-
10
-
11
-
12
-
13
-
14
-
15
-
16
-
17
-
18
-
19
-
20
-
21
-
22
-
23
-
 24
24 -
 25
25 -
 26
26 -
 27
27 -
 28
28 -
 29
29 -
 30
30 -
 31
31 -
 32
32 -
 33
33 -
 34
34 -
 35
35 -
 36
36 -
 37
37 -
 38
38 -
 39
39 -
 40
40 -
 41
41 -
 42
42 -
 43
43 -
 44
44 -
45
-
46
-
47
-
48
-
49
-
50
-
51
-
52
-
53
-
54
-
55
-
56
-
57
-
58
-
59
-
60
-
61
-
62
-
63
-
64
-
65
-
66
-
67
-
68
-
69
-
70
-
71
-
72
-
73
-
74
-
75
-
76
-
77
-
78
-
79
-
80
-
81
-
82
-
83
-
84
-
85
-
86
-
87
-
88
-
89
-
90
-
91
-
92
-
93
-
94
-
95
-
96
-
97
-
98
-
99
-
100
 |
 |

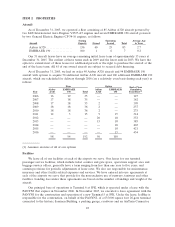
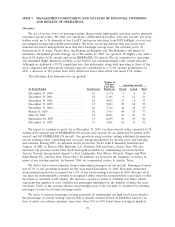
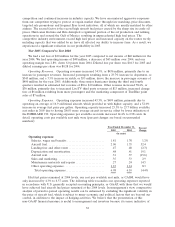
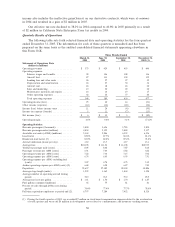
ITEM 6. SELECTED FINANCIAL DATA
The following financial information for the five years ended December 31, 2005 has been derived
from our consolidated financial statements. This information should be read in conjunction with the
consolidated financial statements and related notes thereto included elsewhere in this report.
Year Ended December 31,
2005 2004 2003 2002 2001
(in millions, except per share data)
Statements of Operations Data:
Operating revenues ..................... $ 1,701 $ 1,265 $ 998 $ 635 $ 321
Operating expenses:
Salaries, wages and benefits ............ 428 337 267 162 85
Aircraft fuel ......................... 488 255 147 76 42
Landing fees and other rents ........... 112 92 70 44 27
Depreciation and amortization ......... 115 77 51 27 10
Aircraft rent ......................... 74 70 60 41 33
Sales and marketing................... 81 63 54 44 28
Maintenance materials and repairs ...... 64 45 23 9 5
Other operating expenses.............. 291 215 159 127 64
Total operating expenses (1) ......... 1,653 1,154 831 530 294
Operating income....................... 48 111 167 105 27
Government compensation (2) ........... — — 23 — 19
Other income (expense) ................. (72) (36) (16) (10) (4)
Income (loss) before income taxes ........ (24) 75 174 95 42
Income tax expense (benefit) (3) ......... (4) 29 71 40 3
Net income (loss)....................... $ (20) $ 46 $ 103 $ 55 $ 39
Earnings (loss) per common share:
Basic................................ $ (0.13) $ 0.30 $ 0.71 $ 0.49 $ 2.93
Diluted.............................. $ (0.13) $ 0.28 $ 0.64 $ 0.37 $ 0.34
Other Financial Data:
Operating margin....................... 2.8%8.8%16.8%16.5%8.4%
Ratio of earnings to fixed charges (4) ..... — 1.6x 3.1x 2.7x 1.9x
Net cash provided by operating activities . . $ 170 $ 199 $ 287 $ 217 $ 111
Net cash used in investing activities ....... (1,276) (720) (987) (880) (365)
Net cash provided by financing activities. . . 1,093 437 789 657 262
(1) In 2005, we recorded $7 million in non-cash stock-based compensation expense related to the
acceleration of certain employee stock options and wrote-off $6 million in development costs
relating to a maintenance and inventory tracking system that will not be implemented.
(2) In 2003, we received $23 million in compensation under the Emergency War Time Supplemental
Appropriations Act. In 2001, we received $19 million in compensation under the Air
Transportation Safety and System Stabilization Act.
(3) In 2001, our income tax expense was reduced due to the full reversal of our deferred tax asset
valuation allowance.
(4) Earnings were inadequate to cover fixed charges by $39 million for the year ended
December 31, 2005.
26