Honda 2012 Annual Report Download - page 66
Download and view the complete annual report
Please find page 66 of the 2012 Honda annual report below. You can navigate through the pages in the report by either clicking on the pages listed below, or by using the keyword search tool below to find specific information within the annual report.-
 1
1 -
2
-
3
-
4
-
5
-
6
-
7
-
8
-
9
-
10
-
11
-
12
-
13
-
14
-
15
-
16
-
17
-
18
-
19
-
20
-
21
-
22
-
23
-
24
-
25
-
26
-
27
-
28
-
29
-
30
-
31
-
32
-
33
-
34
-
35
-
36
-
37
-
38
-
39
-
40
-
41
-
42
-
43
-
44
-
45
-
46
-
47
-
48
-
49
-
50
-
51
-
52
-
53
-
54
-
55
-
 56
56 -
 57
57 -
 58
58 -
 59
59 -
 60
60 -
 61
61 -
 62
62 -
 63
63 -
 64
64 -
 65
65 -
 66
66 -
 67
67 -
 68
68 -
 69
69 -
 70
70
 |
 |

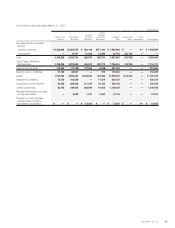
Selected Quarterly Financial Data
Yen (millions except per share amounts)
Fiscal year ended March 31, 2011 Fiscal year ended March 31, 2012
Q1 Q2 Q3 Q4 Q1 Q2 Q3 Q4
Net sales and other operating
revenue ¥2,361,463 ¥2,251,911 ¥2,110,414 ¥2,213,079 ¥1,714,596 ¥1,885,892 ¥1,942,545 ¥2,405,062
Operating income 234,443 163,473 125,653 46,206 22,579 52,511 44,298 111,976
Income before income taxes and
equity in income of affiliates 256,149 166,204 131,580 76,615 29,299 76,555 58,492 93,057
Net income attributable to
Honda Motor Co., Ltd. 272,487 135,929 81,118 44,554 31,797 60,429 47,662 71,594
Basic net income attributable to
Honda Motor Co., Ltd. ¥ 150.27 ¥ 75.24 ¥ 45.01 ¥ 24.72 ¥ 17.64 ¥ 33.53 ¥ 26.45 ¥ 39.72
Tokyo Stock Exchange:
(TSE) (in yen)
High ¥ 3,405 ¥ 3,065 ¥ 3,315 ¥ 3,745 ¥ 3,255 ¥ 3,295 ¥ 2,511 ¥ 3,300
Low 2,570 2,470 2,713 2,820 2,843 2,227 2,127 2,393
New York Stock Exchange:
(NYSE) (in U.S. dollars)
High $ 36.16 $ 35.89 $ 39.69 $ 44.54 $ 39.59 $ 41.23 $ 32.65 $ 39.35
Low 28.33 28.43 33.82 36.51 33.76 28.90 27.52 31.11
Annual Report 201264