Honda 2012 Annual Report Download - page 64
Download and view the complete annual report
Please find page 64 of the 2012 Honda annual report below. You can navigate through the pages in the report by either clicking on the pages listed below, or by using the keyword search tool below to find specific information within the annual report.-
 1
1 -
2
-
3
-
4
-
5
-
6
-
7
-
8
-
9
-
10
-
11
-
12
-
13
-
14
-
15
-
16
-
17
-
18
-
19
-
20
-
21
-
22
-
23
-
24
-
25
-
26
-
27
-
28
-
29
-
30
-
31
-
32
-
33
-
34
-
35
-
36
-
37
-
38
-
39
-
40
-
41
-
42
-
43
-
44
-
45
-
46
-
47
-
48
-
49
-
50
-
51
-
52
-
53
-
 54
54 -
 55
55 -
 56
56 -
 57
57 -
 58
58 -
 59
59 -
 60
60 -
 61
61 -
 62
62 -
 63
63 -
 64
64 -
 65
65 -
 66
66 -
 67
67 -
 68
68 -
 69
69 -
 70
70
 |
 |

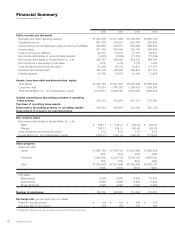
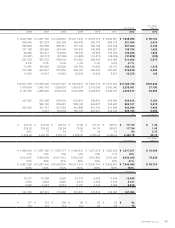
Financial Summary
Fiscal years ended March 31
2002 2003 2004 2005
Sales, income and dividends
Net sales and other operating revenue ¥7,362,438 ¥7,971,499 ¥8,162,600 ¥8,650,105
Operating income 661,202 724,527 600,144 630,920
Income before income taxes and equity in income of affiliates 555,854 619,413 653,680 668,364
Income taxes 231,150 245,065 252,740 266,665
Equity in income of affiliates 42,515 61,972 75,151 96,057
Net income attributable to noncontrolling interests (4,512) (9,658) (11,753) (11,559)
Net income attributable to Honda Motor Co., Ltd. 362,707 426,662 464,338 486,197
Net income as a percentage of net sales 4.9% 5.4% 5.7% 5.6%
Cash dividends paid during the period 24,360 30,176 33,541 47,797
Research and development 395,176 436,863 448,967 467,754
Interest expense 16,769 12,207 10,194 11,655
Assets, long-term debt and shareholders’ equity
Total assets ¥7,064,787 ¥7,821,403 ¥8,380,549 ¥9,368,236
Long-term debt 716,614 1,140,182 1,394,612 1,559,500
Total Honda Motor Co., Ltd. shareholders’ equity 2,573,941 2,629,720 2,874,400 3,289,294
Capital expenditures (excluding purchase of operating
lease assets) 303,424 316,991 287,741 373,980
Purchase of operating lease assets
Depreciation (excluding property on operating leases) 194,944 220,874 213,445 225,752
Depreciation of property on operating leases
Per common share
Net income attributable to Honda Motor Co., Ltd.:
Basic ¥ 186.11 ¥ 219.71 ¥ 243.45 ¥ 260.34
Diluted 186.11 219.71 243.45 260.34
Cash dividends paid during the period 12.5 15.5 17.5 25.5
Honda Motor Co., Ltd. shareholders’ equity 1,320.77 1,367.34 1,527.45 1,778.24
Sales progress
Sales amounts:*
Japan ¥1,868,746 ¥1,748,706 ¥1,628,493 ¥1,699,205
25% 22% 20% 20%
Overseas 5,493,692 6,222,793 6,534,107 6,950,900
75% 78% 80% 80%
Total ¥7,362,438 ¥7,971,499 ¥8,162,600 ¥8,650,105
100% 100% 100% 100%
Unit sales:
Motorcycles 6,095 8,080 9,206 10,482
Automobiles 2,666 2,888 2,983 3,242
Power Products 3,926 4,584 5,047 5,300
Number of employees 120,600 126,900 131,600 137,827
Exchange rate (yen amounts per U.S. dollar)
Rates for the period-end ¥ 133 ¥ 120 ¥ 106 ¥ 107
Average rates for the period 125 122 113 108
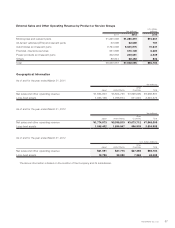
The geographic breakdown of sales amounts is based on the location of customers.
Annual Report 201262