Honda 2012 Annual Report Download - page 35
Download and view the complete annual report
Please find page 35 of the 2012 Honda annual report below. You can navigate through the pages in the report by either clicking on the pages listed below, or by using the keyword search tool below to find specific information within the annual report.-
 1
1 -
2
-
3
-
4
-
5
-
6
-
7
-
8
-
9
-
10
-
11
-
12
-
13
-
14
-
15
-
16
-
17
-
18
-
19
-
20
-
21
-
22
-
23
-
24
-
 25
25 -
 26
26 -
 27
27 -
 28
28 -
 29
29 -
 30
30 -
 31
31 -
 32
32 -
 33
33 -
 34
34 -
 35
35 -
 36
36 -
 37
37 -
 38
38 -
 39
39 -
 40
40 -
 41
41 -
 42
42 -
 43
43 -
 44
44 -
 45
45 -
46
-
47
-
48
-
49
-
50
-
51
-
52
-
53
-
54
-
55
-
56
-
57
-
58
-
59
-
60
-
61
-
62
-
63
-
64
-
65
-
66
-
67
-
68
-
69
-
70
 |
 |

Financial Review
Operating and Financial Review
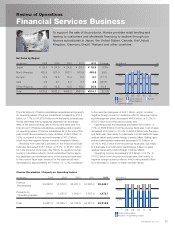
Net Sales and Other Operating Revenue
Honda’s consolidated net sales and other operating revenue
(hereafter, “net sales”) for the fiscal year ended March 31,
2012, decreased ¥988.7 billion, or 11.1%, to ¥7,948.0 billion
from the fiscal year ended March 31, 2011, due mainly to
decreased net sales in Automobile business by the Great East
Japan Earthquake, the floods in Thailand and negative foreign
currency translation effects, which was partially offset by
increased net sales in Motorcycle business. Honda estimates
that by applying Japanese yen exchange rates of the previous
fiscal year to the current fiscal year, net sales for the year
would have decreased by approximately ¥555.6 billion, or
6.2%, compared to the decrease as reported of ¥988.7 billion,
which includes negative foreign currency translation effects.
Operating Costs and Expenses
Operating costs and expenses decreased ¥650.3 billion, or
7.8%, to ¥7,716.7 billion from the previous fiscal year. Cost of
sales decreased ¥577.2 billion, or 8.9%, to ¥5,919.6 billion
from the previous fiscal year, due mainly to a decrease in
costs attributable to decreased unit sales in Automobile busi-
ness and positive foreign currency effects. Selling, general
and administrative expenses decreased by ¥105.3 billion, or
7.6%, to ¥1,277.2 billion from the previous fiscal year, due
mainly to a decrease in selling expenses attributable to
decreased product warranty expenses, decreased unit sales
in Automobile business, and positive foreign currency effects.
R&D expenses increased by ¥32.2 billion, or 6.6%, to ¥519.8
billion from the previous fiscal year, due mainly to improving
safety and environmental technologies and enhancing of the
attractiveness of the products.
Operating Income
Operating income decreased ¥338.4 billion, or 59.4%, to
¥231.3 billion from the previous fiscal year, due mainly to a
decrease in income attributable to decreased net sales,
increased R&D expenses and negative foreign currency
effects, which was partially offset by decreased selling,
general and administrative expenses. Excluding negative
foreign currency effects of ¥114.0 billion, Honda estimates
operating income decreased ¥224.3 billion.
With respect to the discussion above of the changes, man-
agement identified the factors and used what it believes to be
a reasonable method to analyze the respective changes in
such factors. Management analyzed changes in these factors
at the levels of the Company and its material consolidated
subsidiaries. “Foreign currency effects” consist of “translation
adjustments”, which come from the translation of the currency
of foreign subsidiaries’ financial statements into Japanese yen,
and “foreign currency adjustments”, which result from foreign-
currency-denominated sales. With respect to “foreign cur-
rency adjustments”, management analyzed foreign currency
adjustments primarily related to the following currencies: U.S.
dollar, Euro, Japanese yen and others at the level of the
Company and its material consolidated subsidiaries.
Income before Income Taxes and Equity in
Income of Affiliates
Income before income taxes and equity in income of affiliates
decreased ¥373.1 billion, or 59.2%, to ¥257.4 billion. Main
factors of this decrease except factors relating operating
income are as follows:
Unrealized gains and losses related to derivative instru-
ments had a negative impact of ¥5.9 billion. Other income
(expenses) excluding unrealized gains and losses related to
derivative instruments had a negative impact of ¥28.7 billion,
due mainly to gain on sales of investments in affiliates related
to the dissolution of the joint venture, which was included in
the previous fiscal year and a decrease in foreign currency
transaction gains.
Income Tax Expense
Income tax expense decreased ¥71.0 billion, or 34.4%, to
¥135.7 billion from the previous fiscal year. The effective tax
rate increased 19.9 percentage points to 52.7% from the pre-
vious fiscal year. The increase in the effective tax rate was due
mainly to a decrease in a portion of unrecognized tax benefits
related to transfer pricing matters of overseas transactions
between the Company and foreign affiliates, which was
included in the previous fiscal year and adjustments for the
change in income tax laws in Japan in the current fiscal year.
Equity in Income of Affiliates
Equity in income of affiliates decreased ¥39.3 billion, or
28.2%, to ¥100.4 billion, due mainly to a decrease in income
attributable to decreased net sales by the Great East Japan
Earthquake at affiliates in Asia and Japan, and decreased
Equity in income of the affiliate which was dissolved pursuant
to a joint venture agreement in the previous fiscal year.
Net Income
Net income decreased ¥341.4 billion, or 60.6%, to ¥222.0
billion from the previous fiscal year.
Net Income Attributable to Noncontrolling Interests
Net income attributable to noncontrolling interests decreased
¥18.7 billion, or 64.0%, to ¥10.5 billion from the previous
fiscal year.
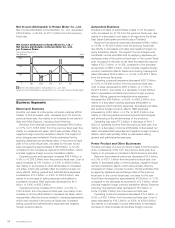
Net Sales and Other Operating Revenue
Years ended March 31
Yen (billions)
4,000
8,000
12,000
008 09 10 11 12
Honda Motor Co., Ltd. 33