Honda 2012 Annual Report Download - page 16
Download and view the complete annual report
Please find page 16 of the 2012 Honda annual report below. You can navigate through the pages in the report by either clicking on the pages listed below, or by using the keyword search tool below to find specific information within the annual report.-
 1
1 -
2
-
3
-
4
-
5
-
 6
6 -
 7
7 -
 8
8 -
 9
9 -
 10
10 -
 11
11 -
 12
12 -
 13
13 -
 14
14 -
 15
15 -
 16
16 -
 17
17 -
 18
18 -
 19
19 -
 20
20 -
 21
21 -
 22
22 -
 23
23 -
 24
24 -
 25
25 -
 26
26 -
27
-
28
-
29
-
30
-
31
-
32
-
33
-
34
-
35
-
36
-
37
-
38
-
39
-
40
-
41
-
42
-
43
-
44
-
45
-
46
-
47
-
48
-
49
-
50
-
51
-
52
-
53
-
54
-
55
-
56
-
57
-
58
-
59
-
60
-
61
-
62
-
63
-
64
-
65
-
66
-
67
-
68
-
69
-
70
 |
 |

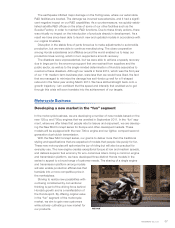
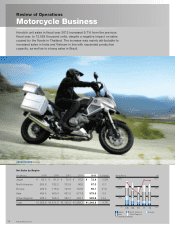
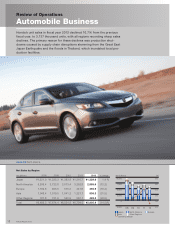
Review of Operations
Motorcycle Business
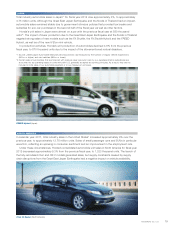
Honda’s unit sales in fiscal year 2012 increased 9.7% from the previous
fiscal year, to 12,559 thousand units, despite a negative impact on sales
caused by the floods in Thailand. The increase was mainly attributable to
increased sales in India and Vietnam in line with expanded production
capacity, as well as to strong sales in Brazil.
CROSSTOURER
(Europe)
Japan North America Europe
Asia Other Regions
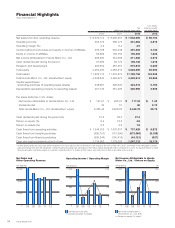
Operating Margin
Yen (billions) (%)
600
1,200
1,800
0
4.0
8.0
12.0
0.0
08 09 10 11 12
Yen (billions) 2008 2009 2010 2011 2012 % change
Japan ¥ 93.5 ¥ 81.8 ¥ 70.4 ¥ 70.2 ¥ 72.9 3.8%
North America 265.6 182.2 103.9 96.6 97.3 0.7
Europe 226.6 178.6 124.6 103.8 96.1 (7.5)
Asia 484.4 460.4 461.0 577.6 579.5 0.3
Other Regions 488.3 508.3 380.1 439.7 502.8 14.4
Total ¥1,558.6 ¥1,411.5 ¥1,140.2 ¥1,288.1 ¥1,348.8 4.7%
Net Sales by Region
Annual Report 201214