Honda 2012 Annual Report Download - page 15
Download and view the complete annual report
Please find page 15 of the 2012 Honda annual report below. You can navigate through the pages in the report by either clicking on the pages listed below, or by using the keyword search tool below to find specific information within the annual report.-
 1
1 -
2
-
3
-
4
-
 5
5 -
 6
6 -
 7
7 -
 8
8 -
 9
9 -
 10
10 -
 11
11 -
 12
12 -
 13
13 -
 14
14 -
 15
15 -
 16
16 -
 17
17 -
 18
18 -
 19
19 -
 20
20 -
 21
21 -
 22
22 -
 23
23 -
 24
24 -
 25
25 -
26
-
27
-
28
-
29
-
30
-
31
-
32
-
33
-
34
-
35
-
36
-
37
-
38
-
39
-
40
-
41
-
42
-
43
-
44
-
45
-
46
-
47
-
48
-
49
-
50
-
51
-
52
-
53
-
54
-
55
-
56
-
57
-
58
-
59
-
60
-
61
-
62
-
63
-
64
-
65
-
66
-
67
-
68
-
69
-
70
 |
 |

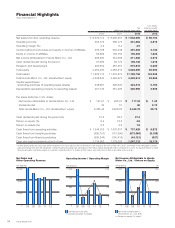
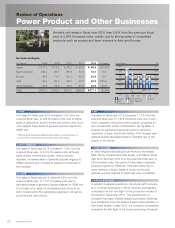
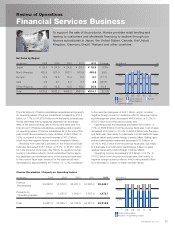
Percentage of Net Sales by Business Percentage of Net Sales by Business
Net Sales / Operating Income (Loss)
Yen (billions)
Net Sales / Operating Income
Yen (billions)
Unit Sales by Region
(Thousands)
Finance Receivables / Property on Operating Leases
Yen (billions)
Power Product and Other Businesses Financial Services Business
3.5%6.5%
Pianta FV200
Net Sales (left scale) Operating Income (right scale) Net Sales (left scale) Operating Income (Loss) (right scale)
2010 2011 2012 Finance Receivables Property on Operating Leases
0
250
500
0
20
40
–20
08 09 10 11 12
200
400
600
800
0
100
200
300
400
0
08 09 10 11 12
Japan North
America
Europe Asia Other
Regions
392
2,314
1,121
1,472
520
08 09 10 11 12
1,473
3,446
2,000
4,000
6,000
0
Honda Motor Co., Ltd. 13