Honda 2012 Annual Report Download - page 6
Download and view the complete annual report
Please find page 6 of the 2012 Honda annual report below. You can navigate through the pages in the report by either clicking on the pages listed below, or by using the keyword search tool below to find specific information within the annual report.-
 1
1 -
 2
2 -
 3
3 -
 4
4 -
 5
5 -
 6
6 -
 7
7 -
 8
8 -
 9
9 -
 10
10 -
 11
11 -
 12
12 -
 13
13 -
 14
14 -
 15
15 -
 16
16 -
 17
17 -
18
-
19
-
20
-
21
-
22
-
23
-
24
-
25
-
26
-
27
-
28
-
29
-
30
-
31
-
32
-
33
-
34
-
35
-
36
-
37
-
38
-
39
-
40
-
41
-
42
-
43
-
44
-
45
-
46
-
47
-
48
-
49
-
50
-
51
-
52
-
53
-
54
-
55
-
56
-
57
-
58
-
59
-
60
-
61
-
62
-
63
-
64
-
65
-
66
-
67
-
68
-
69
-
70
 |
 |

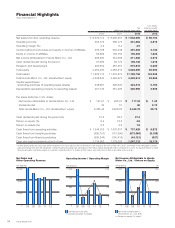
Operating Income / Operating Margin
Yen (billions) (%)
Financial Highlights
Years ended March 31
Operating income (left)
Operating margin (%) (right)
Net income attributable to
Honda Motor Co., Ltd. (left)
Return on equity (%) (right)
Net Sales and
Other Operating Revenue
Yen (billions)
Net Income Attributable to Honda
Motor Co., Ltd. / Return on Equity
Yen (billions) (%)
Yen
(millions except per share data)
U.S. dollars
(millions except
per share data)
2010 2011 2012 2012
Net sales and other operating revenue ¥ 8,579,174 ¥ 8,936,867 ¥ 7,948,095 $ 96,704
Operating income 363,775 569,775 231,364 2,815
Operating margin (%) 4.2 6.4 2.9
Income before income taxes and equity in income of affiliates 336,198 630,548 257,403 3,132
Equity in income of affiliates 93,282 139,756 100,406 1,222
Net income attributable to Honda Motor Co., Ltd. 268,400 534,088 211,482 2,573
Cash dividends paid during the period 61,696 92,170 108,138 1,316
Research and development 463,354 487,591 519,818 6,325
Total equity 4,456,430 4,582,912 4,528,290 55,094
Total assets 11,629,115 11,570,874 11,780,759 143,336
Total Honda Motor Co., Ltd. shareholders’ equity 4,328,640 4,449,975 4,402,614 53,565
Capital expenditures
(excluding purchase of operating lease assets) 348,981 326,620 424,413 5,164
Depreciation (excluding property on operating leases) 401,743 351,496 320,996 3,906
Per share data (Yen / U.S. dollar)
Net income attributable to Honda Motor Co., Ltd. ¥ 147.91 ¥ 295.67 ¥ 117.34 $ 1.43
Dividends paid 34 51 60 0.73
Total Honda Motor Co., Ltd. stockholders’ equity 2,385.45 2,469.05 2,442.78 29.72
Cash dividends paid during the period (%) 37.2 38.5 37.4
Return on equity (%) 6.4 12.2 4.8
Return on assets (%) 2.3 4.6 1.8
Cash flows from operating activities ¥ 1,544,212 ¥ 1,070,837 ¥ 737,429 $ 8,972
Cash flows from investing activities (595,751) (731,390) (673,069) (8,189)
Cash flows from financing activities (559,244) (100,416) (44,121) (537)
Cash and cash equivalents at end of year 1,119,902 1,279,024 1,247,113 15,174
* United States dollar amounts have been translated from yen solely for the convenience of the reader at the rate of ¥82.19=U.S.$1, the mean of the telegraphic transfer
selling exchange rate and the telegraphic transfer buying exchange rate prevailing on the Tokyo foreign exchange market on March 31, 2012. No representation is made
that yen amounts could have been, or could be, converted into U.S. dollars at that rate or any other rate on this or any other date or at all.
4,000
8,000
12,000
008 09 10 11 12
250
750
500
1,000
0
2.5
7.5
5.0
10.0
0
08 09 10 11 12
200
400
600
0
5.0
10.0
15.0
0
08 09 10 11 12
Annual Report 201204