Honda 2012 Annual Report Download - page 55
Download and view the complete annual report
Please find page 55 of the 2012 Honda annual report below. You can navigate through the pages in the report by either clicking on the pages listed below, or by using the keyword search tool below to find specific information within the annual report.-
 1
1 -
2
-
3
-
4
-
5
-
6
-
7
-
8
-
9
-
10
-
11
-
12
-
13
-
14
-
15
-
16
-
17
-
18
-
19
-
20
-
21
-
22
-
23
-
24
-
25
-
26
-
27
-
28
-
29
-
30
-
31
-
32
-
33
-
34
-
35
-
36
-
37
-
38
-
39
-
40
-
41
-
42
-
43
-
44
-
 45
45 -
 46
46 -
 47
47 -
 48
48 -
 49
49 -
 50
50 -
 51
51 -
 52
52 -
 53
53 -
 54
54 -
 55
55 -
 56
56 -
 57
57 -
 58
58 -
 59
59 -
 60
60 -
 61
61 -
 62
62 -
 63
63 -
 64
64 -
 65
65 -
66
-
67
-
68
-
69
-
70
 |
 |

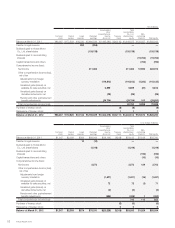
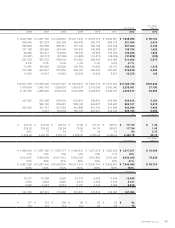
Yen (millions)
U.S. dollars
(millions)
2011 2012 2012
Cash flows from operating activities :
Net income ¥ 563,477 ¥ 222,074 $ 2,702
Adjustments to reconcile net income to net cash provided by operating activities:
Depreciation excluding property on operating leases 351,496 320,996 3,906
Depreciation of property on operating leases 212,143 209,762 2,552
Deferred income taxes 130,180 49,661 604
Equity in income of affiliates (139,756) (100,406) (1,222)
Dividends from affiliates 98,182 95,106 1,157
Gain on sales of investments in affiliates (46,756) — —
Provision for credit and lease residual losses on finance
subsidiaries-receivables 13,305 13,032 159
Impairment loss on investments in securities 2,133 1,062 13
Damaged and impairment loss on long-lived assets excluding
property on operating leases 16,833 10,590 129
Impairment loss on property on operating leases 835 1,514 18
Loss (gain) on derivative instruments, net (7,788) (1,847) (22)
Decrease (increase) in assets:
Trade accounts and notes receivable 38,700 (35,475) (432)
Inventories (33,676) (154,222) (1,876)
Other current assets 266 2,883 35
Other assets (40,729) (24,000) (292)
Increase (decrease) in liabilities:
Trade accounts and notes payable (55,331) 242,814 2,954
Accrued expenses 39,103 (25,718) (313)
Income taxes payable 9,461 (7,568) (92)
Other current liabilities 32,209 (12,395) (151)
Other liabilities (83,115) (14,744) (179)
Other, net (30,335) (55,690) (678)
Net cash provided by operating activities 1,070,837 737,429 8,972
Cash flows from investing activities:
Increase in investments and advances (11,412) (23,129) (281)
Decrease in investments and advances 13,995 14,647 178
Payments for purchases of available-for-sale securities (262) (1,784) (22)
Proceeds from sales of available-for-sale securities 2,739 1,879 23
Payments for purchases of held-to-maturity securities (179,951) (26,078) (317)
Proceeds from redemptions of held-to-maturity securities 154,977 47,193 574
Proceeds from sales of investments in affiliates 71,073 9,957 121
Capital expenditures (318,543) (397,218) (4,833)
Proceeds from sales of property, plant and equipment 24,725 23,260 283
Proceeds from insurance recoveries for damaged property, plant and equipment
—16,217 197
Acquisitions of finance subsidiaries-receivables (1,927,673) (1,784,720) (21,714)
Collections of finance subsidiaries-receivables 1,829,097 1,765,204 21,477
Purchases of operating lease assets (798,420) (683,767) (8,319)
Proceeds from sales of operating lease assets 408,265 365,270 4,444
Net cash used in investing activities (731,390) (673,069) (8,189)
Cash flows from financing activities:
Increase (decrease) in short-term debt, net 113,669 (104,596) (1,273)
Proceeds from long-term debt 799,520 1,151,971 14,017
Repayments of long-term debt (870,406) (967,588) (11,773)
Dividends paid (92,170) (108,138) (1,316)
Dividends paid to noncontrolling interests (16,232) (15,763) (192)
Sales (purchases) of treasury stock, net (34,797) (7) (0)
Net cash used in financing activities (100,416) (44,121) (537)
Effect of exchange rate changes on cash and cash equivalents (79,909) (52,150) (634)
Net change in cash and cash equivalents 159,122 (31,911) (388)
Cash and cash equivalents at beginning of year 1,119,902 1,279,024 15,562
Cash and cash equivalents at end of year ¥ 1,279,024 ¥ 1,247,113 $ 15,174
Consolidated Statements of Cash Flows
Years ended March 31, 2011 and 2012
Honda Motor Co., Ltd. 53