Honda 2012 Annual Report Download - page 36
Download and view the complete annual report
Please find page 36 of the 2012 Honda annual report below. You can navigate through the pages in the report by either clicking on the pages listed below, or by using the keyword search tool below to find specific information within the annual report.-
 1
1 -
2
-
3
-
4
-
5
-
6
-
7
-
8
-
9
-
10
-
11
-
12
-
13
-
14
-
15
-
16
-
17
-
18
-
19
-
20
-
21
-
22
-
23
-
24
-
25
-
 26
26 -
 27
27 -
 28
28 -
 29
29 -
 30
30 -
 31
31 -
 32
32 -
 33
33 -
 34
34 -
 35
35 -
 36
36 -
 37
37 -
 38
38 -
 39
39 -
 40
40 -
 41
41 -
 42
42 -
 43
43 -
 44
44 -
 45
45 -
 46
46 -
47
-
48
-
49
-
50
-
51
-
52
-
53
-
54
-
55
-
56
-
57
-
58
-
59
-
60
-
61
-
62
-
63
-
64
-
65
-
66
-
67
-
68
-
69
-
70
 |
 |

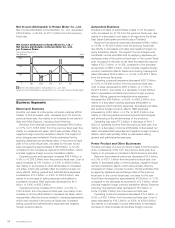
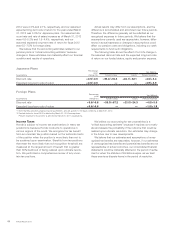
Net Income Attributable to Honda Motor Co., Ltd.
Net income attributable to Honda Motor Co., Ltd. decreased
¥322.6 billion, or 60.4%, to ¥211.4 billion from the previous
fiscal year.
Business Segments
Motorcycle Business
Honda’s unit sales of motorcycles, all-terrain vehicles (ATVs)
totaled 12,559 thousand units, increased by 9.7% from the
previous fiscal year, due mainly to an increase in unit sales in
Asia and Other Regions, including South America.
Revenue from external customers increased ¥60.6 billion,
or 4.7%, to ¥1,348.8 billion from the previous fiscal year, due
mainly to increased unit sales, which was partially offset by
negative foreign currency translation effects. The impact of
price changes was immaterial. Honda estimates that by
applying Japanese yen exchange rates of the previous fiscal
year to the current fiscal year, net sales for the year would
have increased by approximately ¥158.6 billion, or 12.3%,
compared to the increase as reported of ¥60.6 billion, which
includes negative foreign currency translation effects.
Operating costs and expenses increased ¥56.6 billion, or
4.9%, to ¥1,206.2 billion from the previous fiscal year. Cost of
sales increased by ¥51.0 billion, or 5.8%, to ¥939.0 billion,
due mainly to an increase in costs attributable to increased
unit sales, which was partially offset by positive foreign cur-
rency effects. Selling, general and administrative expenses
increased by ¥10.0 billion, or 5.2%, to ¥203.8 billion, due
mainly to an increase in selling expenses attributable to
increased unit sales. R&D expenses decreased by ¥4.4
billion, or 6.6%, to ¥63.3 billion.
Operating income increased ¥4.0 billion, or 2.9%, to
¥142.6 billion from the previous fiscal year, due mainly to an
increase in income attributable to increased net sales, which
was partially offset by income related to licensing agreements
which was included in the previous fiscal year, increased
selling, general and administrative expenses and negative
foreign currency effects.
Automobile Business
Honda’s unit sales of automobiles totaled 3,137 thousand
units, decreased by 10.7% from the previous fiscal year, due
mainly to a decrease in unit sales in all regions by the Great
East Japan Earthquake and the floods in Thailand.
Revenue from external customers decreased ¥988.1 billion,
or 14.5%, to ¥5,805.9 billion from the previous fiscal year,
due mainly to decreased unit sales and negative foreign cur-
rency translation effects. The impact of price changes was
immaterial. Honda estimates that by applying Japanese yen
exchange rates of the previous fiscal year to the current fiscal
year, net sales for the year would have decreased by approxi-
mately ¥702.7 billion, or 10.3%, compared to the decrease
as reported of ¥988.1 billion, which includes negative foreign
currency translation effects. Revenue including intersegment
sales decreased ¥979.5 billion, or 14.4%, to ¥5,822.7 billion
from the previous fiscal year.
Operating costs and expenses decreased ¥637.8 billion,
or 9.8%, to ¥5,899.9 billion from the previous fiscal year.
Cost of sales decreased by ¥587.2 billion, or 11.5%, to
¥4,518.5 billion, due mainly to a decrease in costs attribut-
able to decreased unit sales and positive foreign currency
effects. Selling, general and administrative expenses
decreased by ¥88.6 billion, or 8.5%, to ¥953.5 billion, due
mainly to a decrease in selling expenses attributable to
decreased product warranty expenses, decreased unit sales,
and positive foreign currency effects. R&D expenses
increased by ¥38.0 billion, or 9.7%, to ¥427.8 billion, due
mainly to improving safety and environmental technologies
and enhancing of the attractiveness of the products.
Operating loss was ¥77.2 billion, a decrease of ¥341.7
billion of operating income from the previous fiscal year, due
mainly to a decrease in income attributable to decreased net
sales, increased R&D expenses and negative foreign currency
effects, which was partially offset by decreased selling,
general and administrative expenses.
Power Product and Other Businesses
Honda’s unit sales of power products totaled 5,819 thousand
units, increased by 5.6% from the previous fiscal year, due
mainly to an increase in unit sales in North America and Asia.
Revenue from external customers decreased ¥15.5 billion,
or 5.3%, to ¥277.1 billion from the previous fiscal year, due
mainly to decreased sales of other business, negative foreign
currency translation effects, which was partially offset by
increased unit sales of power products. Honda estimates that
by applying Japanese yen exchange rates of the previous
fiscal year to the current fiscal year, net sales for the year
would have decreased by approximately ¥4.8 billion, or 1.7%,
compared to the decrease as reported of ¥15.5 billion, which
includes negative foreign currency translation effects. Revenue
including intersegment sales decreased ¥18.0 billion, or
5.9%, to ¥289.7 billion from the previous fiscal year.
Operating costs and expenses decreased ¥19.5 billion, or
6.2%, to ¥293.7 billion from the previous fiscal year. Cost of
sales decreased by ¥19.5 billion, or 8.6%, to ¥208.6 billion,
due mainly to a decrease in costs attributable to decreased
net sales of other business and positive foreign currency
Net Income Attributable to Honda Motor Co., Ltd. /
Net Income Attributable to Honda Motor Co., Ltd.
per Common Share
Years ended March 31
Yen (billions) (Yen)
Net Income Attributable to Honda Motor Co., Ltd. (left)
Net Income Attributable to Honda Motor Co., Ltd. per Common Share (right)
200
400
600
0
150
300
450
0
08 09 10 11 12
Annual Report 201234