Honda 2012 Annual Report Download - page 20
Download and view the complete annual report
Please find page 20 of the 2012 Honda annual report below. You can navigate through the pages in the report by either clicking on the pages listed below, or by using the keyword search tool below to find specific information within the annual report.-
 1
1 -
2
-
3
-
4
-
5
-
6
-
7
-
8
-
9
-
 10
10 -
 11
11 -
 12
12 -
 13
13 -
 14
14 -
 15
15 -
 16
16 -
 17
17 -
 18
18 -
 19
19 -
 20
20 -
 21
21 -
 22
22 -
 23
23 -
 24
24 -
 25
25 -
 26
26 -
 27
27 -
 28
28 -
 29
29 -
 30
30 -
31
-
32
-
33
-
34
-
35
-
36
-
37
-
38
-
39
-
40
-
41
-
42
-
43
-
44
-
45
-
46
-
47
-
48
-
49
-
50
-
51
-
52
-
53
-
54
-
55
-
56
-
57
-
58
-
59
-
60
-
61
-
62
-
63
-
64
-
65
-
66
-
67
-
68
-
69
-
70
 |
 |

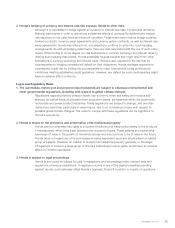
Review of Operations
Automobile Business
Japan North America Europe
Asia Other Regions
Operating Margin
0
7,500
2,500
5,000
10,000
–2,500
0.0
6.0
2.0
4.0
8.0
–2.0
08 09 10 11 12
Yen (billions) (%)
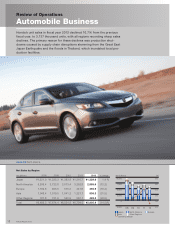
Honda’s unit sales in fiscal year 2012 declined 10.7% from the previous
fiscal year, to 3,137 thousand units, with all regions recording sharp sales
declines. The primary reason for these declines was production shut-
downs caused by supply chain disruptions stemming from the Great East
Japan Earthquake and the floods in Thailand, which inundated local pro-
duction facilities.
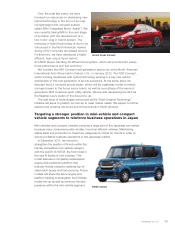
Acura ILX
(North America)
Yen (billions) 2008 2009 2010 2011 2012 % change
Japan ¥1,321.0 ¥1,225.3 ¥1,383.8 ¥1,310.7 ¥1,329.6 1.4 %
North America 5,209.4 3,723.8 3,013.4 3,252.8 2,855.6 (12.2)
Europe 1,182.6 923.5 575.3 441.6 355.9 (19.4)
Asia 1,048.4 1,079.5 1,041.2 1,221.7 836.3 (31.5)
Other Regions 727.8 721.9 540.9 567.1 428.3 (24.5)
Total ¥9,489.3 ¥7,674.4 ¥6,554.8 ¥6,794.0 ¥5,805.9 (14.5)%
Net Sales by Region
Annual Report 201218