Honda 2012 Annual Report Download - page 63
Download and view the complete annual report
Please find page 63 of the 2012 Honda annual report below. You can navigate through the pages in the report by either clicking on the pages listed below, or by using the keyword search tool below to find specific information within the annual report.-
 1
1 -
2
-
3
-
4
-
5
-
6
-
7
-
8
-
9
-
10
-
11
-
12
-
13
-
14
-
15
-
16
-
17
-
18
-
19
-
20
-
21
-
22
-
23
-
24
-
25
-
26
-
27
-
28
-
29
-
30
-
31
-
32
-
33
-
34
-
35
-
36
-
37
-
38
-
39
-
40
-
41
-
42
-
43
-
44
-
45
-
46
-
47
-
48
-
49
-
50
-
51
-
52
-
 53
53 -
 54
54 -
 55
55 -
 56
56 -
 57
57 -
 58
58 -
 59
59 -
 60
60 -
 61
61 -
 62
62 -
 63
63 -
 64
64 -
 65
65 -
 66
66 -
 67
67 -
 68
68 -
 69
69 -
 70
70
 |
 |

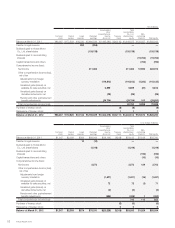
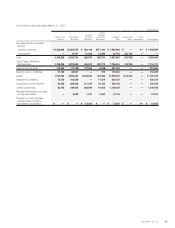
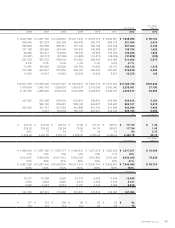
Consolidated Statements of Cash Flows
Divided into Non-Financial Services Businesses
and Finance Subsidiaries
Years ended March 31, 2011 and 2012 Yen (millions)
2011 2012
Non-financial
services
businesses
Finance
subsidiaries
Reconciling
Items Consolidated
Non-financial
services
businesses
Finance
subsidiaries
Reconciling
Items Consolidated
Cash flows from operating activities:
Net Income ¥ 456,181 ¥ 107,296 ¥ — ¥ 563,477 ¥ 109,016 ¥ 113,058 ¥ — ¥ 222,074
Adjustments to reconcile net income to
net cash provided by operating activities:
Depreciation 349,834 213,805 —563,639 319,433 211,325 —530,758
Deferred income taxes 28,691 101,489 —130,180 (20,191) 69,852 —49,661
Equity in income of affiliates (139,756) — — (139,756) (100,406) — — (100,406)
Dividends from affiliates 98,182 — — 98,182 95,106 — — 95,106
Gain on sales of investments in affiliates
(46,756) — — (46,756) — — — —
Damaged and impairment loss on
long-lived assets 16,833 835 —17,668 10,590 1,514 —12,104
Loss (gain) on derivative instruments, net
670 (8,458) —(7,788) 12,140 (13,987) —(1,847)
Decrease (increase) in trade accounts
and notes receivable 26,837 12,413 (550) 38,700 (34,607) (2,516) 1,648 (35,475)
Decrease (increase) in inventories (33,676) — — (33,676) (154,222) — — (154,222)
Increase (decrease) in trade accounts
and notes payable (50,618) —(4,713) (55,331) 240,003 —2,811 242,814
Other, net (71,664) 13,342 620 (57,702) (83,705) (14,627) (24,806) (123,138)
Net cash provided by operating activities
634,758 440,722 (4,643) 1,070,837 393,157 364,619 (20,347) 737,429
Cash flows from investing activities:
Decrease (increase) in investments
and advances* (41,730) 4,951 16,865 (19,914) 32,166 (9,305) (10,133) 12,728
Proceeds from sales of investments
in affiliates 71,073 — — 71,073 9,957 — — 9,957
Capital expenditures (316,472) (2,071) —(318,543) (394,490) (2,728) —(397,218)
Proceeds from sales of property,
plant and equipment 24,089 636 —24,725 23,091 169 —23,260
Proceeds from insurance recoveries for
damage property, plant and equipment — — — — 16,217 — — 16,217
Decrease (increase) in finance
subsidiaries-receivables —(90,859) (7,717) (98,576) —(16,014) (3,502) (19,516)
Purchase of operating lease assets
—(798,420) —(798,420) —(683,767) —(683,767)
Proceeds from sales of operating
lease assets —408,265 —408,265 —365,270 —365,270
Net cash provided by (used in)
investing activities (263,040) (477,498) 9,148 (731,390) (313,059) (346,375) (13,635) (673,069)
Cash flows from financing activities:
Increase (decrease) in short-term debt, net*
11,270 107,495 (5,096) 113,669 38,622 (162,515) 19,297 (104,596)
Proceeds from long-term debt* 18,174 786,399 (5,053) 799,520 100,865 1,058,570 (7,464) 1,151,971
Repayment of long-term debt* (27,539) (848,511) 5,644 (870,406) (72,207) (917,530) 22,149 (967,588)
Dividends paid (92,170) — — (92,170) (108,138) — — (108,138)
Dividends paid to noncontrolling
interests (16,232) — — (16,232) (15,763) — — (15,763)
Sales (purchases) of treasury stock, net (34,797) — — (34,797) (7) — — (7)
Net cash provided by (used in)
financing activities (141,294) 45,383 (4,505) (100,416) (56,628) (21,475) 33,982 (44,121)
Effect of exchange rate changes on
cash and cash equivalents (78,757) (1,152) —(79,909) (51,647) (503) —(52,150)
Net change in cash and cash equivalents
151,667 7,455 —159,122 (28,177) (3,734) —(31,911)
Cash and cash equivalents at
beginning of period 1,100,695 19,207 —1,119,902 1,252,362 26,662 —1,279,024
Cash and cash equivalents at
end of period ¥1,252,362 ¥ 26,662 ¥ — ¥1,279,024 ¥1,224,185 ¥ 22,928 ¥ —¥1,247,113
Notes: 1. Non-financial services businesses lend to finance subsidiaries. These cash flows are included in the decrease (increase) in investments and advances, increase
(decrease) in short-term debt, proceeds from long-term debt, and repayment of long-term debt (marked by *). The amount of the loans to finance subsidiaries
is a ¥16,865 million increase for the fiscal year ended March 31, 2011, and a ¥10,133 million decrease for the fiscal year ended March 31, 2012, respectively.
2. Decrease (increase) in trade accounts and notes receivable for finance subsidiaries is due to the reclassification of finance subsidiaries-receivables which relate
to sales of inventory in the consolidated statements of cash flows presented above.
Honda Motor Co., Ltd. 61