Honda 2012 Annual Report Download - page 24
Download and view the complete annual report
Please find page 24 of the 2012 Honda annual report below. You can navigate through the pages in the report by either clicking on the pages listed below, or by using the keyword search tool below to find specific information within the annual report.-
 1
1 -
2
-
3
-
4
-
5
-
6
-
7
-
8
-
9
-
10
-
11
-
12
-
13
-
 14
14 -
 15
15 -
 16
16 -
 17
17 -
 18
18 -
 19
19 -
 20
20 -
 21
21 -
 22
22 -
 23
23 -
 24
24 -
 25
25 -
 26
26 -
 27
27 -
 28
28 -
 29
29 -
 30
30 -
 31
31 -
 32
32 -
 33
33 -
 34
34 -
35
-
36
-
37
-
38
-
39
-
40
-
41
-
42
-
43
-
44
-
45
-
46
-
47
-
48
-
49
-
50
-
51
-
52
-
53
-
54
-
55
-
56
-
57
-
58
-
59
-
60
-
61
-
62
-
63
-
64
-
65
-
66
-
67
-
68
-
69
-
70
 |
 |

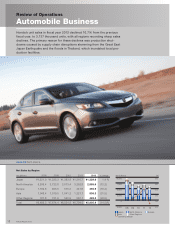
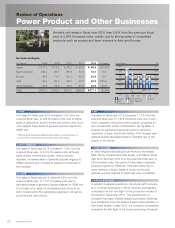
Review of Operations
Power Product and Other Businesses
JAPAN
Unit sales for fiscal year 2012 increased 1.0% from the
previous fiscal year, to 392 thousand units, due to higher
sales of generators, snow blowers and certain other prod-
ucts, despite lower sales of general-purpose engines for
OEM* use.
* OEM (Original Equipment Manufacturer) refers to manufacturers of
products and components sold under a third-party brand.
NORTH AMERICA
Unit sales in fiscal year 2012 increased 11.0% from the
previous fiscal year, to 2,314 thousand units. Although
sales of lawn mowers and certain other products
declined, increased sales of general-purpose engines to
OEM manufacturers of pressure washers contributed to
the increase.
EUROPE
Unit sales in fiscal year 2012 declined 4.5% from the
previous fiscal year, to 1,121 thousand units due to
decreased sales of general-purpose engines for OEM use.
On a bright note, sales of completed products such as
lawn mowers and other gardening equipment, as well as
snow blowers were strong.
Japan North America Europe
Asia Other Regions
Operating Margin
0
400
300
200
100
500
–100
0.0
24.0
18.0
12.0
6.0
30.0
–6.0
08 09 10 11 12
Yen (billions) (%)
Honda’s unit sales in fiscal year 2012 rose 5.6% from the previous fiscal
year to 5,819 thousand units, mainly due to strong sales of completed
products such as pumps and lawn mowers in Asia and Europe.
ASIA
Unit sales in fiscal year 2012 increased 11.1% from the
previous fiscal year, to 1,472 thousand units due to eco-
nomic expansion and government support programs for
farm households, which contributed to strong sales of
engines for agricultural equipment and construction
machinery, pumps, and brush cutters. This increase was
realized despite decreased sales in Thailand due to the
impact of the floods.
OTHER REGIONS
In Other Regions (including South America, the Middle
East, Africa, Oceania and other areas), unit sales in fiscal
year 2012 declined 3.2% from the previous fiscal year, to
520 thousand units, the result of lower sales of general-
purpose engines for OEM use. This was mainly due to
lower demand in Brazil. Sales of brush cutters and
general-purpose engines for OEM use rose in Australia.
AVIATION BUSINESS
In aviation business operations, Honda Aircraft Company,
LLC, a Honda subsidiary in North America, successfully
completed the first test flight of the production model of
HondaJet in December 2010. The development of
HondaJet has been steadily advancing toward obtaining
type certification from the Federal Aviation Administration in
the United States. In May 2012, the company successfully
completed the first flight of the fourth conforming HondaJet.
Yen (billions) 2008 2009 2010 2011 2012 % change
Japan ¥147.7 ¥115.2 ¥ 98.3 ¥ 96.5 ¥ 86.4 (10.4)%
North America 109.4 80.1 65.8 67.9 72.1 6.3
Europe 96.8 71.1 54.3 55.2 55.4 0.3
Asia 39.4 50.7 36.7 49.3 40.0 (18.9)
Other Regions 27.6 25.8 22.3 23.6 23.0 (2.6)
Total ¥421.1 ¥343.0 ¥277.6 ¥292.6 ¥277.1 (5.3)%
Net Sales by Region
Annual Report 201222