Honda 2012 Annual Report Download - page 60
Download and view the complete annual report
Please find page 60 of the 2012 Honda annual report below. You can navigate through the pages in the report by either clicking on the pages listed below, or by using the keyword search tool below to find specific information within the annual report.-
 1
1 -
2
-
3
-
4
-
5
-
6
-
7
-
8
-
9
-
10
-
11
-
12
-
13
-
14
-
15
-
16
-
17
-
18
-
19
-
20
-
21
-
22
-
23
-
24
-
25
-
26
-
27
-
28
-
29
-
30
-
31
-
32
-
33
-
34
-
35
-
36
-
37
-
38
-
39
-
40
-
41
-
42
-
43
-
44
-
45
-
46
-
47
-
48
-
49
-
 50
50 -
 51
51 -
 52
52 -
 53
53 -
 54
54 -
 55
55 -
 56
56 -
 57
57 -
 58
58 -
 59
59 -
 60
60 -
 61
61 -
 62
62 -
 63
63 -
 64
64 -
 65
65 -
 66
66 -
 67
67 -
 68
68 -
 69
69 -
 70
70
 |
 |

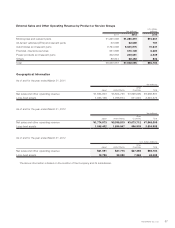
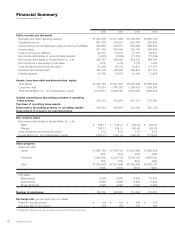
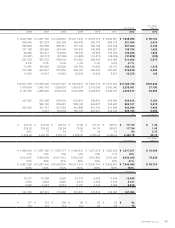
Supplemental Geographical Information
In addition to the disclosure required by U.S. GAAP, Honda provides the following supplemental information in order to provide
financial statements users with additional useful information:
Supplemental geographical information based on the location of the Company and its subsidiaries
As of and for the year ended March 31, 2011
Yen (millions)
Japan
North
America Europe Asia
Other
Regions Total
Reconciling
Items
Other
Adjust-
ments Consolidated
Net sales and other
operating revenue:
External customers ¥1,834,003 ¥3,941,505 ¥618,426 ¥1,594,058 ¥948,875 ¥ 8,936,867 ¥ — ¥ — ¥ 8,936,867
Transfers between
geographic areas 1,777,204 206,392 80,872 247,109 33,208 2,344,785 (2,344,785) — —
Total 3,611,207 4,147,897 699,298 1,841,167 982,083 11,281,652 (2,344,785) —8,936,867
Cost of sales, SG&A and
R&D expenses 3,545,089 3,846,975 709,501 1,690,530 912,534 10,704,629 (2,351,660) 14,123 8,367,092
Operating income (loss) 66,118 300,922 (10,203) 150,637 69,549 577,023 6,875 (14,123) 569,775
Assets 2,875,630 6,209,145 564,678 1,049,113 658,636 11,357,202 213,672 —11,570,874
Long-lived assets ¥1,053,168 ¥1,852,542 ¥106,633 ¥ 231,867 ¥147,363 ¥ 3,391,573 ¥ — ¥ — ¥ 3,391,573
As of and for the year ended March 31, 2012
Yen (millions)
Japan
North
America Europe Asia
Other
Regions Total
Reconciling
Items
Other
Adjust-
ments Consolidated
Net sales and other
operating revenue:
External customers ¥1,774,573 ¥3,500,245 ¥519,329 ¥1,276,621 ¥877,327 ¥ 7,948,095 ¥ —¥— ¥ 7,948,095
Transfers between
geographic areas 1,588,379 214,511 61,463 213,857 15,805 2,094,015 (2,094,015) — —
Total 3,362,952 3,714,756 580,792 1,490,478 893,132 10,042,110 (2,094,015) —7,948,095
Cost of sales, SG&A and
R&D expenses 3,472,786 3,491,463 592,901 1,413,608 836,176 9,806,934 (2,090,203) —7,716,731
Operating income (loss) (109,834) 223,293 (12,109) 76,870 56,956 235,176 (3,812) —231,364
Assets 3,106,061 6,333,851 568,790 1,070,331 611,818 11,690,851 89,908 —11,780,759
Long-lived assets ¥1,048,402 ¥1,970,631 ¥111,354 ¥ 274,182 ¥130,339 ¥ 3,534,908 ¥ —¥— ¥ 3,534,908
Annual Report 201258