Honda 2012 Annual Report Download - page 48
Download and view the complete annual report
Please find page 48 of the 2012 Honda annual report below. You can navigate through the pages in the report by either clicking on the pages listed below, or by using the keyword search tool below to find specific information within the annual report.-
 1
1 -
2
-
3
-
4
-
5
-
6
-
7
-
8
-
9
-
10
-
11
-
12
-
13
-
14
-
15
-
16
-
17
-
18
-
19
-
20
-
21
-
22
-
23
-
24
-
25
-
26
-
27
-
28
-
29
-
30
-
31
-
32
-
33
-
34
-
35
-
36
-
37
-
 38
38 -
 39
39 -
 40
40 -
 41
41 -
 42
42 -
 43
43 -
 44
44 -
 45
45 -
 46
46 -
 47
47 -
 48
48 -
 49
49 -
 50
50 -
 51
51 -
 52
52 -
 53
53 -
 54
54 -
 55
55 -
 56
56 -
 57
57 -
 58
58 -
59
-
60
-
61
-
62
-
63
-
64
-
65
-
66
-
67
-
68
-
69
-
70
 |
 |

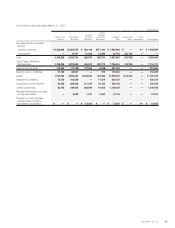
Interest Rate Risk
Finance Subsidiaries-Receivables
Years ended March 31 2011 2012
Yen (millions) Yen (millions)
Average
interest
rate
(%)
Expected maturity date
Total Fair value Total
Within
1 year
1-2
years
2-3
years
3-4
years
4-5
years
There-
after
Fair
value
Direct financing leases
JP¥ ¥ 31,329 *1¥ 73,920 14,143 30,175 16,470 8,542 4,579 11 *13.98
Other 330,807 *1306,419 82,525 78,152 71,570 57,738 15,364 1,070 *12.32
Total—Direct financing
leases ¥ 362,136 *1380,339 96,668 108,327 88,040 66,280 19,943 1,081 *1
Other finance
subsidiaries-receivables
JP¥ ¥ 500,213 505,615 ¥ 525,494 171,326 117,623 95,220 67,148 52,954 21,223 521,726 3.98
US$ 2,554,404 2,588,307 2,541,603 918,770 612,930 488,833 334,605 149,616 36,849 2,574,794 4.03
Other 615,039 607,296 562,365 259,847 139,231 90,406 49,319 17,781 5,781 557,330 6.73
Total—Other finance
subsidiaries-receivables ¥3,669,656 3,701,218 ¥3,629,462 1,349,943 869,784 674,459 451,072 220,351 63,853 3,653,850
Total*2¥4,031,792 ¥4,009,801
*1 Under U.S. generally accepted accounting principles, disclosure of fair values of direct financing leases is not required.
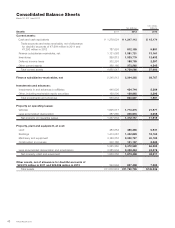
*2 The finance subsidiaries-receivables include finance subsidiaries-receivables contained in trade accounts and notes receivable and other assets in the consolidated
balance sheets.
Long-Term Debt (including current portion)
Years ended March 31 2011 2012
Yen (millions) Yen (millions)
Average
interest
rate
(%)
Expected maturity date
Total Fair value Total
Within
1 year
1-2
years
2-3
years
3-4
years
4-5
years
There-
after Fair value
Japanese yen bonds ¥ 320,000 322,270 ¥ 330,000 120,000 40,000 30,000 60,000 80,000 —331,770 0.80
Japanese yen medium-term
notes (Fixed rate) 102,226 102,896 67,740 25,093 6,447 5,951 27,274 —2,975 68,266 1.21
Japanese yen medium-term
notes (Floating rate) 80,619 80,770 63,574 58,119 3,471 —1,984 — — 63,655 0.49
U.S. dollar medium-term
notes (Fixed rate) 451,891 477,827 692,185 40,908 139,910 175,910 81,819 102,273 151,365 732,402 3.48
U.S. dollar medium-term
notes (Floating rate) 297,285 299,014 155,535 88,937 13,172 8,181 42,381 2,864 —156,450 0.97
Asset backed notes 453,802 458,794 511,384 245,093 176,163 79,442 10,686 — — 515,790 1.18
Loans and others—
primarily fixed rate 1,299,872 1,322,989 1,325,978 333,245 335,389 272,585 88,763 294,457 1,539 1,343,180 3.01
Total ¥3,005,695 3,064,560 ¥3,146,396 911,395 714,552 572,069 312,907 479,594 155,879 3,211,513
Annual Report 201246