Honda 2012 Annual Report Download - page 25
Download and view the complete annual report
Please find page 25 of the 2012 Honda annual report below. You can navigate through the pages in the report by either clicking on the pages listed below, or by using the keyword search tool below to find specific information within the annual report.-
 1
1 -
2
-
3
-
4
-
5
-
6
-
7
-
8
-
9
-
10
-
11
-
12
-
13
-
14
-
 15
15 -
 16
16 -
 17
17 -
 18
18 -
 19
19 -
 20
20 -
 21
21 -
 22
22 -
 23
23 -
 24
24 -
 25
25 -
 26
26 -
 27
27 -
 28
28 -
 29
29 -
 30
30 -
 31
31 -
 32
32 -
 33
33 -
 34
34 -
 35
35 -
36
-
37
-
38
-
39
-
40
-
41
-
42
-
43
-
44
-
45
-
46
-
47
-
48
-
49
-
50
-
51
-
52
-
53
-
54
-
55
-
56
-
57
-
58
-
59
-
60
-
61
-
62
-
63
-
64
-
65
-
66
-
67
-
68
-
69
-
70
 |
 |

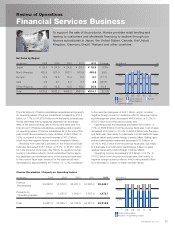
Review of Operations
Financial Services Business
The total amount of finance subsidiaries-receivables and property
on operating leases of finance subsidiaries increased by ¥81.2
billion, or 1.7%, to ¥4,918.8 billion from the previous fiscal year.
Honda estimates that by applying Japanese yen exchange
rates of the previous fiscal year to the current fiscal year, the
total amount of finance subsidiaries-receivables and property
on operating leases of finance subsidiaries as of the end of the
year would have increased by approximately ¥168.0 billion, or
3.5%, compared to the reported increase of ¥81.2 billion,
which includes negative foreign currency translation effects.
Revenue from external customers in the financial services
business decreased ¥45.7 billion, or 8.1%, to ¥516.1 billion
from the previous fiscal year, due mainly to negative foreign
currency translation effects. Honda estimates that by apply-
ing Japanese yen exchange rates of the previous fiscal year
to the current fiscal year, revenue for the year would have
decreased by approximately ¥6.7 billion, or 1.2%, compared
To support the sale of its products, Honda provides retail lending and
leasing to customers and wholesale financing to dealers through our
finance subsidiaries in Japan, the United States, Canada, the United
Kingdom, Germany, Brazil, Thailand and other countries.
to the reported decrease of ¥45.7 billion, which includes
negative foreign currency translation effects. Revenue includ-
ing intersegment sales decreased ¥46.8 billion, or 8.2%, to
¥526.5 billion from the previous fiscal year.
Operating costs and expenses decreased ¥30.6 billion, or
7.9%, to ¥356.5 billion from the previous fiscal year. Cost of sales
decreased ¥16.6 billion, or 5.4%, to ¥293.2 billion from the previ-
ous fiscal year, due mainly to a decrease in costs related to lease
residual values and positive foreign currency effect. Selling, gen-
eral and administrative expenses decreased ¥13.9 billion, or
18.1%, to ¥63.3 billion from the previous fiscal year, due mainly
to a decrease in provisions for credit losses, losses on lease
residual values and positive foreign currency effects.
Operating income decreased ¥16.2 billion, or 8.7%, to
¥170.0 billion from the previous fiscal year, due mainly to
negative foreign currency effects, which was partially offset
by a decrease in losses on lease residual values.
Japan North America Europe
Asia Other Regions
Operating Margin
Finance Receivables
Property on Operating Leases
250
500
750
0
20.0
40.0
60.0
0.0
08 09 10 11 12
2,000
4,000
6,000
008 09 10 11 12
Yen (billions) (%)
Yen (billions)
Yen (billions) 2008 2009 2010 2011 2012 % change
Japan ¥ 23.4 ¥ 24.0 ¥ 24.6 ¥ 26.3 ¥ 28.9 9.8%
North America 483.9 527.9 553.1 503.9 455.5 (9.6)
Europe 13.2 12.6 10.4 9.2 8.1 (11.7)
Asia 4.9 4.7 4.3 3.7 2.8 (22.8)
Other Regions 8.0 12.8 13.8 18.5 20.6 10.8
Total ¥533.5 ¥582.2 ¥606.3 ¥561.8 ¥516.1 (8.1)%
Net Sales by Region
Yen (billions) 2008 2009 2010 2011 2012
Finance
Receivables ¥4,048.5 ¥3,572.3 ¥3,461.5 ¥3,480.0 ¥3,446.1
Property on
Operating Leases 919.0 1,287.8 1,308.1 1,357.6 1,472.7
Total ¥4,967.5 ¥4,860.1 ¥4,769.6 ¥4,837.6 ¥4,918.8
Finance Receivables / Property on Operating Leases
Honda Motor Co., Ltd. 23