Honda 2012 Annual Report Download - page 61
Download and view the complete annual report
Please find page 61 of the 2012 Honda annual report below. You can navigate through the pages in the report by either clicking on the pages listed below, or by using the keyword search tool below to find specific information within the annual report.-
 1
1 -
2
-
3
-
4
-
5
-
6
-
7
-
8
-
9
-
10
-
11
-
12
-
13
-
14
-
15
-
16
-
17
-
18
-
19
-
20
-
21
-
22
-
23
-
24
-
25
-
26
-
27
-
28
-
29
-
30
-
31
-
32
-
33
-
34
-
35
-
36
-
37
-
38
-
39
-
40
-
41
-
42
-
43
-
44
-
45
-
46
-
47
-
48
-
49
-
50
-
 51
51 -
 52
52 -
 53
53 -
 54
54 -
 55
55 -
 56
56 -
 57
57 -
 58
58 -
 59
59 -
 60
60 -
 61
61 -
 62
62 -
 63
63 -
 64
64 -
 65
65 -
 66
66 -
 67
67 -
 68
68 -
 69
69 -
 70
70
 |
 |

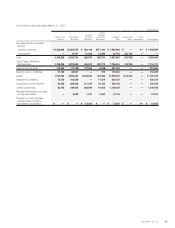
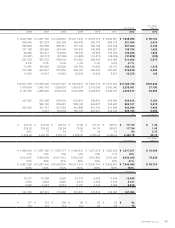
As of and for the year ended March 31, 2012
U.S. dollars (millions)
Japan
North
America Europe Asia
Other
Regions Total
Reconciling
Items
Other
Adjust-
ments Consolidated
Net sales and other
operating revenue:
External customers $21,591 $42,587 $6,319 $15,533 $10,674 $ 96,704 $ —$— $ 96,704
Transfers between
geographic areas 19,326 2,610 748 2,602 192 25,478 (25,478) — —
Total 40,917 45,197 7,067 18,135 10,866 122,182 (25,478) —96,704
Cost of sales, SG&A and
R&D expenses 42,253 42,480 7,214 17,200 10,174 119,321 (25,432) —93,889
Operating income (loss) (1,336) 2,717 (147) 935 692 2,861 (46) —2,815
Assets 37,791 77,064 6,920 13,023 7,444 142,242 1,094 —143,336
Long-lived assets $12,756 $23,977 $1,355 $ 3,336 $ 1,585 $ 43,009 $ —$— $ 43,009
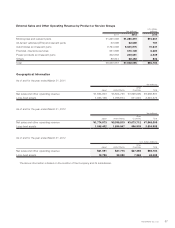
Explanatory notes:
1. Major countries or regions in each geographic area:
North America ...........United States, Canada, Mexico
Europe ................United Kingdom, Germany, France, Italy, Belgium
Asia ..................Thailand, Indonesia, China, India, Vietnam
Other Regions ...........Brazil, Australia
2. Operating income (loss) of each geographical region is measured in a consistent manner with consolidated operating income, which is income before income taxes and
equity in income of affiliates before other income (expenses), except Other Adjustments, which are out-of-period adjustments. Out-of-period adjustments were the
losses resulted from inventory management trading activities at a domestic subsidiary. This domestic subsidiary temporarily purchased sea food products from seafood
companies with the promise that they would buy back such products after certain period, in order to bridge the gap between the purchasing period (the fishing season)
and the sales period for sea food products. The Company recognized the related cumulative losses at the beginning of the fiscal year ended March 31, 2011 in selling,
general and administrative expenses in the consolidated statement of income for the year ended March 31, 2011. The adjustments were not included in Japan but as
Other Adjustments for the year ended March 31, 2011.
3. Assets of each geographical region are defined as total assets, including derivative financial instruments, investments in affiliates, and deferred tax assets.
4. Sales and revenues between geographic areas are generally made at values that approximate arm’s-length prices.
5. Unallocated corporate assets, included in reconciling items, amounted to ¥453,116 million as of March 31, 2011, and ¥399,732 million as of March 31, 2012, which
consist primarily of cash and cash equivalents, available-for-sale securities, and held-to- maturity securities held by the Company. Reconciling items also include elimi-
nation of transactions between geographic areas.
6. For the years ended March 31, 2011 and 2012, impact of the Great East Japan Earthquake is included in Cost of sales, SG&A and R&D expenses of Japan.
7. For the year ended March 31, 2012, impact of the floods in Thailand is included in Cost of sales, SG&A and R&D expenses of Asia.
Basis of Translating Financial Statements
The consolidated financial statements and Segment Information are expressed in Japanese yen. However, the consolidated
financial statements and Segment Information as of and for the year ended March 31, 2012 have been translated into United
States dollars at the rate of ¥82.19 = U.S.$1, the approximate exchange rate prevailing on the Tokyo Foreign Exchange Market on
March 31, 2012. Those U.S. dollar amounts presented in the consolidated financial statements and Segment Information are
included solely for the reader. This translation should not be construed as a representation that all the amounts shown could be
converted into U.S. dollars.
Honda Motor Co., Ltd. 59