Honda 2012 Annual Report Download - page 40
Download and view the complete annual report
Please find page 40 of the 2012 Honda annual report below. You can navigate through the pages in the report by either clicking on the pages listed below, or by using the keyword search tool below to find specific information within the annual report.-
 1
1 -
2
-
3
-
4
-
5
-
6
-
7
-
8
-
9
-
10
-
11
-
12
-
13
-
14
-
15
-
16
-
17
-
18
-
19
-
20
-
21
-
22
-
23
-
24
-
25
-
26
-
27
-
28
-
29
-
 30
30 -
 31
31 -
 32
32 -
 33
33 -
 34
34 -
 35
35 -
 36
36 -
 37
37 -
 38
38 -
 39
39 -
 40
40 -
 41
41 -
 42
42 -
 43
43 -
 44
44 -
 45
45 -
 46
46 -
 47
47 -
 48
48 -
 49
49 -
 50
50 -
51
-
52
-
53
-
54
-
55
-
56
-
57
-
58
-
59
-
60
-
61
-
62
-
63
-
64
-
65
-
66
-
67
-
68
-
69
-
70
 |
 |

In Motorcycle business, we made capital expenditures of
¥62,075 million in the fiscal year ended March 31, 2012. Funds
were allocated to the introduction of new models, as well as
the improvement, streamlining and modernization of produc-
tion facilities, and improvement of sales and R&D facilities.
In Automobile business, we made capital expenditures of
¥334,196 million in the fiscal year ended March 31, 2012.
Funds were allocated to the introduction of new models, as well
as the improvement, streamlining and modernization of produc-
tion facilities, and improvement of sales and R&D facilities.
In Financial services business, capital expenditures
excluding property on operating leases amounted to ¥316
million in the fiscal year ended March 31, 2012, while capital
expenditures for property on operating leases were ¥683,767
million. Capital expenditures in Power product and other
businesses in the fiscal year ended March 31, 2012, totaling
¥10,005 million, were deployed to upgrade, streamline and
modernize manufacturing facilities for power products, and to
improve R&D facilities for power products.
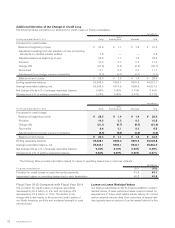
Plans after Fiscal 2012
Honda de Mexico, S.A. de C.V., which is one of the Company’s
consolidated subsidiaries, plans to build a new auto plant in
Guanajuato, Mexico with an investment of approximately
$800 million. The annual production capacity of this new
plant will be approximately 200,000 units. This new plant is
planned to start operation from the first half of 2014.
Our original capital expenditure plans for the period from
the fiscal year ended March 31, 2012 during the preceding
fiscal year have not changed.
The estimated amounts of capital expenditures for the
fiscal year ending March 31, 2013 are shown below.
Yen (millions)
Fiscal year ending March 31, 2013 2013
Motorcycle Business ¥ 71,000
Automobile Business 496,800
Financial Services Business 400
Power Product and Other Businesses 11,800
Total ¥580,000
Note: The estimated amount of capital expenditures for Financial services business
in the above table does not include property on operating leases.
Intangible assets are not included in the table above.
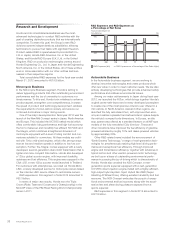
Liquidity and Capital Resources
Overview of Capital Requirements,
Sources and Uses
The policy of Honda is to support its business activities by
maintaining sufficient capital resources, a sufficient level of
liquidity and a sound balance sheet.
Honda’s main business is the manufacturing and sale of
motorcycles, automobiles and power products. To support
this business, it also provides retail financing and automobile
leasing services for customers, as well as wholesale financing
services for dealers.
Honda requires working capital mainly to purchase parts
and raw materials required for production, as well as to main-
tain inventory of finished products and cover receivables from
dealers and for providing financial services. Honda also requires
funds for capital expenditures, mainly to introduce new models,
upgrade, rationalize and renew production facilities, as well as
to expand and reinforce sales and R&D facilities.
Honda meets its working capital requirements primarily
through cash generated by operations, bank loans and the
issuance of corporate bonds. Honda believes that its working
capital is sufficient for the Company’s present requirements.
The year-end balance of liabilities associated with the Com-
pany and its subsidiaries’ funding for non-Financial services
businesses was ¥463.9 billion as of March 31, 2012. In addi-
tion, the Company’s finance subsidiaries fund financial pro-
grams for customers and dealers primarily from medium-term
notes, bank loans, commercial paper, corporate bonds,
securitization of finance receivables and intercompany loans.
The year-end balance of liabilities associated with these
finance subsidiaries’ funding for Financial services business
was ¥4,113.3 billion as of March 31, 2012.
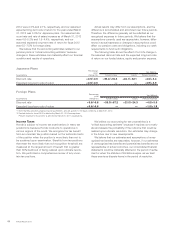
Cash Flows
Consolidated cash and cash equivalents on March 31, 2012
decreased by ¥31.9 billion from March 31, 2011, to ¥1,247.1
billion. The reasons for the increases or decreases for each
cash flow activity, when compared with the previous fiscal
year, are as follows:
Net cash provided by operating activities amounted to
¥737.4 billion of cash inflows. Cash inflows from operating
activities decreased by ¥333.4 billion compared with the
previous fiscal year due mainly to a decrease in cash received
due to decreased unit sales in the Automobile business,
which was partially offset by decreased payments for parts
and raw materials primarily caused by a decrease in automo-
bile production.
Net cash used in investing activities amounted to ¥673.0
billion of cash outflows. Cash outflows from investing activi-
ties decreased by ¥58.3 billion compared with the previous
fiscal year, due mainly to a decrease in acquisitions of finance
subsidiaries-receivables and a decrease in purchases of
operating lease assets, which was partially offset by
increased capital expenditure and a decrease in collections
of finance subsidiaries-receivables.
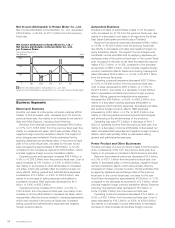
Capital Expenditures and Depreciation
Years ended March 31
Yen (billions)
Capital Expenditures Depreciation
Note: Capital Expenditure and Depreciation aforementioned exclude Capital
Expenditure and Depreciation in operating lease assets and intangible assets.
250
500
750
008 09 10 11 12
Annual Report 201238