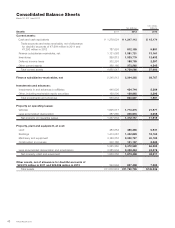
Honda 2012 Annual Report Download - page 58
Download and view the complete annual report
Please find page 58 of the 2012 Honda annual report below. You can navigate through the pages in the report by either clicking on the pages listed below, or by using the keyword search tool below to find specific information within the annual report.-
 1
1 -
2
-
3
-
4
-
5
-
6
-
7
-
8
-
9
-
10
-
11
-
12
-
13
-
14
-
15
-
16
-
17
-
18
-
19
-
20
-
21
-
22
-
23
-
24
-
25
-
26
-
27
-
28
-
29
-
30
-
31
-
32
-
33
-
34
-
35
-
36
-
37
-
38
-
39
-
40
-
41
-
42
-
43
-
44
-
45
-
46
-
47
-
 48
48 -
 49
49 -
 50
50 -
 51
51 -
 52
52 -
 53
53 -
 54
54 -
 55
55 -
 56
56 -
 57
57 -
 58
58 -
 59
59 -
 60
60 -
 61
61 -
 62
62 -
 63
63 -
 64
64 -
 65
65 -
 66
66 -
 67
67 -
 68
68 -
69
-
70
 |
 |

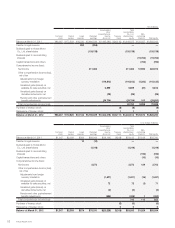
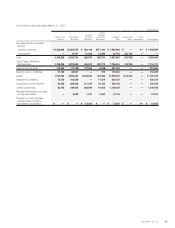
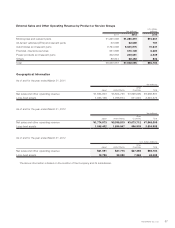
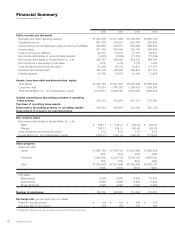
As of and for the year ended March 31, 2012
U.S. dollars (millions)
Motorcycle
Business
Automobile
Business
Financial
Services
Business
Power
Product
and Other
Businesses
Segment
Total
Reconciling
Items
Other
Adjustments Consolidated
Net sales and other operating
revenue:
External customers $16,411 $70,641 $ 6,280 $3,372 $ 96,704 $ —$— $ 96,704
Intersegment —204 127 153 484 (484) — —
Total 16,411 70,845 6,407 3,525 97,188 (484) —96,704
Cost of sales, SG&A and
R&D expenses 14,676 71,784 4,339 3,574 94,373 (484) —93,889
Segment income (loss) 1,735 (939) 2,068 (49) 2,815 — — 2,815
Equity in income of affiliates 379 834 — 9 1,222 — — 1,222
Assets 12,239 60,226 68,675 3,710 144,850 (1,514) —143,336
Investments in affiliates 855 4,178 —208 5,241 — — 5,241
Depreciation and amortization 492 3,271 2,571 124 6,458 — — 6,458
Capital expenditures 755 4,254 8,353 121 13,483 — — 13,483
Damaged and impairment losses
on long-lived assets —100 18 29 147 — — 147
Provision for credit and lease
residual losses on finance
subsidiaries—receivables $ — $ — $ 159 $ — $ 159 $ —$— $ 159
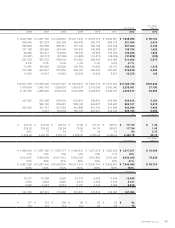
Explanatory notes:
1. Segment income (loss) of each segment is measured in a consistent manner with consolidated operating income, which is income before income taxes and equity in
income of affiliates before other income (expenses), except Other Adjustments, which are out-of-period adjustments. Expenses not directly associated with specific
segments are allocated based on the most reasonable measures applicable. Out-of-period adjustments were the losses resulted from inventory management trading
activities at a domestic subsidiary. This domestic subsidiary temporarily purchased sea food products from seafood companies with the promise that they would buy
back such products after certain period, in order to bridge the gap between the purchasing period (the fishing season) and the sales period for sea food products. The
Company recognized the related cumulative losses at the beginning of the fiscal year ended March 31, 2011 in selling, general and administrative expenses in the
consolidated statement of income for the year ended March 31, 2011. The amount of out-of-period adjustments are not reported to or used by the chief operating
decision maker in deciding how to allocate resources and in assessing the Company’s operating performance. Therefore, the adjustments were not included in Power
product and other businesses but as Other Adjustments for the year ended March 31, 2011.
2. Assets of each segment are defined as total assets, including derivative financial instruments, investments in affiliates and deferred tax assets. Segment assets are
based on those directly associated with each segment and those not directly associated with specific segments are allocated based on the most reasonable measures
applicable except for the corporate assets described below.
3. Intersegment sales and revenues are generally made at values that approximate arm’s-length prices.
4. Unallocated corporate assets, included in reconciling items, amounted to ¥453,116 million as of March 31, 2011, and ¥399,732 million as of March 31, 2012, which
consist primarily of cash and cash equivalents and available-for-sale securities and held-to-maturity securities held by the Company. Reconciling items also include
elimination of intersegment transactions.
5. Depreciation and amortization of Financial services business include ¥212,143 million for the year ended March 31, 2011 and ¥209,762 million for the year ended
March 31, 2012, respectively, of depreciation of property on operating leases.
6. Capital expenditures of Financial services business includes ¥798,420 million for the year ended March 31, 2011 and ¥683,767 million for the year ended March 31,
2012, respectively, purchases of operating lease assets.
7. The amounts of Net sales and other operating revenue-Intersegment for the year ended March 31, 2011 have been corrected from the amounts previously disclosed.
8. For the years ended March 31, 2011 and 2012, impact of the Great East Japan Earthquake is included in Cost of sales, SG&A and R&D expenses of Automobile
business.
9. For the year ended March 31, 2012, impact of the floods in Thailand is included in Cost of sales, SG&A and R&D expenses of Automobile business.
Annual Report 201256