Honda 2012 Annual Report Download - page 44
Download and view the complete annual report
Please find page 44 of the 2012 Honda annual report below. You can navigate through the pages in the report by either clicking on the pages listed below, or by using the keyword search tool below to find specific information within the annual report.
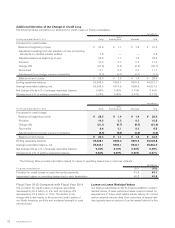
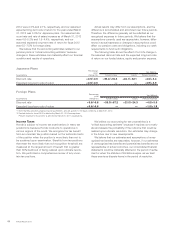
Additional Narrative of the Change in Credit Loss
The following tables summarize our allowance for credit losses on finance receivables:
Yen (billions)
For the year ended March 31, 2011 Retail
Direct
financing lease Wholesale Total
Provisions for credit losses
Balance at beginning of year ¥ 33.9 ¥ 1.7 ¥ 1.6 ¥ 37.3
Adjustment resulting from the adoption of new accounting
standards on variable interest entities 0.8 — — 0.8
Adjusted balance at beginning of year 34.8 1.7 1.6 38.2
Provision 10.3 0.7 0.3 11.3
Charge-offs (27.6) (1.5) (0.5) (29.7)
Recoveries 11.1 0.5 0.0 11.7
Adjustments from foreign currency translation (3.0) (0.0) (0.0) (3.2)
Balance at end of year ¥ 25.5 ¥ 1.4 ¥ 1.4 ¥ 28.4
Ending receivable balance ¥3,368.0 ¥362.1 ¥301.6 ¥4,031.7
Average receivable balance, net ¥3,346.5 ¥374.9 ¥309.5 ¥4,031.0
Net charge-offs as a % of average receivable balance 0.49% 0.26% 0.15% 0.45%
Allowance as a % of ending receivable balance 0.76% 0.40% 0.47% 0.71%
Yen (billions)
For the year ended March 31, 2012 Retail
Direct
financing lease Wholesale Total
Provisions for credit losses
Balance at beginning of year ¥ 25.5 ¥ 1.4 ¥ 1.4 ¥ 28.4
Provision 10.3 0.3 0.0 10.8
Charge-offs (21.1) (0.7) (0.0) (21.9)
Recoveries 6.6 0.1 0.0 6.8
Adjustments from foreign currency translation (0.9) (0.0) (0.0) (1.0)
Balance at end of year ¥ 20.4 ¥ 1.1 ¥ 1.4 ¥ 23.0
Ending receivable balance ¥3,328.1 ¥380.3 ¥301.3 ¥4,009.8
Average receivable balance, net ¥3,233.1 ¥366.1 ¥243.7 ¥3,843.0
Net charge-offs as a % of average receivable balance 0.45% 0.16% 0.03% 0.39%
Allowance as a % of ending receivable balance 0.62% 0.30% 0.46% 0.57%
The following table provides information related to losses on operating leases due to customer defaults:
Yen (billions)
Fiscal years ended March 31 2011 2012
Provision for credit losses on past due rental payments ¥1.6 ¥1.1
Impairment losses on operating leases due to early termination ¥0.8 ¥1.5
Fiscal Year 2012 Compared with Fiscal Year 2011
The provision for credit losses on finance receivables
decreased by ¥0.5 billion, or 5%, and net charge-offs
decreased by ¥2.8 billion, or 16%. The decline in net
charge-offs is due mainly to the improved credit quality of
our North American portfolio and sustained strength in used
vehicle prices.
Losses on Lease Residual Values
Our finance subsidiaries in North America establish contract
residual values of lease vehicles at lease inception based on
expectations of future used vehicle values, taking into consid-
eration external industry data. End-customers of leased vehi-
cles typically have an option to buy the leased vehicle for the
Annual Report 201242


