Frontier Airlines 2004 Annual Report Download - page 38
Download and view the complete annual report
Please find page 38 of the 2004 Frontier Airlines annual report below. You can navigate through the pages in the report by either clicking on the pages listed below, or by using the keyword search tool below to find specific information within the annual report.-
 1
1 -
2
-
3
-
4
-
5
-
6
-
7
-
8
-
9
-
10
-
11
-
12
-
13
-
14
-
15
-
16
-
17
-
18
-
19
-
20
-
21
-
22
-
23
-
24
-
25
-
26
-
27
-
 28
28 -
 29
29 -
 30
30 -
 31
31 -
 32
32 -
 33
33 -
 34
34 -
 35
35 -
 36
36 -
 37
37 -
 38
38 -
 39
39 -
 40
40 -
 41
41 -
 42
42 -
 43
43 -
 44
44 -
 45
45 -
 46
46 -
 47
47 -
 48
48 -
49
-
50
-
51
-
52
-
53
-
54
-
55
-
56
-
57
-
58
-
59
-
60
-
61
-
62
-
63
-
64
-
65
-
66
-
67
-
68
-
69
-
70
-
71
-
72
-
73
-
74
-
75
-
76
-
77
-
78
-
79
-
80
-
81
-
82
-
83
-
84
-
85
-
86
-
87
 |
 |

___________
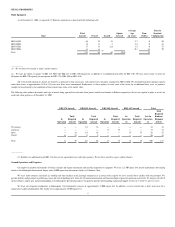
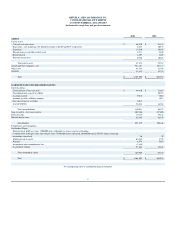
(1) Revenue passenger miles is the number of scheduled miles flown by revenue passengers.
(2) Available seat miles is the number of seats available for passengers multiplied by the number of scheduled miles those seats are flown.
(3) Revenue passenger miles divided by available seat miles.
(4) Total operating and interest expenses divided by available seat miles.
(5) Cost of aircraft fuel, including fuel taxes and into
-
plane fees.
(6) Hours from takeoff to landing, including taxi time.
(7) Average number of hours per day that an aircraft flown in revenue service is operated (from gate departure to gate arrival).
Effects of September 11, 2001
Following the terrorist attacks of September 11, 2001, the FAA immediately suspended the entire air travel system in the United States. This suspension lasted until September 13, 2001,
when limited flights were allowed.
Ronald Reagan Washington National Airport in Washington, D.C., referred to as DCA, was closed until October 4, 2001. Because of US Airways' position as the dominant carrier at
DCA, US Airways has suffered a more severe economic impact than other carriers without such a concentration of flights in and out of DCA.
Subsequent to September 11, 2001, the airline industry experienced an immediate and significant decline in traffic, particularly business traffic (which has a higher yield than leisure traffic).
All of our code
-
share partners experienced significant declines. Under our fixed
-
fee contracts, however, we continued to be reimbursed for our expenses. The impact on our short haul,
turboprop operations was devastating. Due to heightened airport security, it became more convenient for passengers to drive to a hub rather than wait long periods for short flights. Revenues
associated with our "at
-
risk" prorate business suffered declines greater than 50% of normal revenues. Given that the profitability of our turboprop operation was marginal prior to September 11,
2001, we subsequently determined that the operations were unsustainable. Accordingly, we elected to ground over half of our turboprop fleet and subsequently decided to phase out all
Saab 340 operations.
In addition to greatly curtailing our turboprop operation for US Airways, to stem our losses after these attacks, we took the following steps:
•
reduced staffing levels by 20%, consisting of 204 pilots, flight attendants and customer service agents, and 71 other personnel;
•
instituted a hiring freeze;
•
froze pay for salaried employees; and
•
deferred aircraft deliveries.
Further, in conjunction with our curtailing of our US Airways turboprop operations, we determined to terminate all turboprop operations by September 2002.
On September 22, 2001, the President signed into law the Stabilization Act. Among other things, the Stabilization Act:
•
provided $5 billion in payments to compensate U.S. passenger and cargo airlines for losses incurred by the airline industry from September 11, 2001 through December 31, 2001
as a result of the September 11 terrorist attacks;
•
subject to certain conditions and fees, authorized the issuance of up to $10 billion in federal loan guarantees to airlines for which credit is not reasonably available;
•
sought to ensure the continuity of air service to communities, including government subsidized essential air service to small communities;
•
reimbursed airlines for certain increased costs of aviation insurance;
•
extended the due date for payments on certain taxes by airlines;
•
limited the liability of airlines relating to the September 11 attacks; and
•
established a federal compensation fund for the victims of the September 11 terrorist attacks.
Under the Stabilization Act, each airline was entitled to receive the lesser of (a) its direct and incremental pre
-
tax losses for the period of September 11, 2001 to December 31, 2001 or
(b) its available seat mile share of the $5 billion compensation ($4.5 billion for passenger airlines) available under the Stabilization Act. We have received $7.5 million in compensation under the
Years Ended December 31,
2004
Increase/
(Decrease)
2004
-
2003
2003
Increase/
(Decrease)
2003
-
2002
2002
Revenue passengers
6,267,761
35.5
%
4,625,381
37.4
%
3,365,687
Revenue passenger miles (1)
2,953,311,412
33.1
%
2,219,350,701
53.4
%
1,446,534,152
Available seat miles (2)
4,425,391,124
27.7
%
3,464,206,178
47.5
%
2,348,376,444
Passenger load factor (3)
66.7
%
2.6pp
64.1
%
2.5pp
61.6
%
Cost per available seat mile (4)
10.58¢
0.3
%
10.55¢
(
13.7
%)
12.23¢
Average price per gallon of fuel (5)
93.28¢
12.5
%
82.93¢
(
8.5
%)
90.62¢
Fuel gallons consumed
120,914,802
31.9
%
91,675,324
44.7
%
63,358,586
Block hours (6)
333,400
30.5
%
255,572
39.3
%
183,475
Average length of aircraft flight (miles)
464
(1.9
%)
473
10.5
%
428
Average daily utilization of each aircraft (hours) (7)
10:32
3.4
%
10:11
4.3
%
9:46
Aircraft in service at end of period
111
33.7
%
83
40.7
%
59