Frontier Airlines 2004 Annual Report Download - page 30
Download and view the complete annual report
Please find page 30 of the 2004 Frontier Airlines annual report below. You can navigate through the pages in the report by either clicking on the pages listed below, or by using the keyword search tool below to find specific information within the annual report.-
 1
1 -
2
-
3
-
4
-
5
-
6
-
7
-
8
-
9
-
10
-
11
-
12
-
13
-
14
-
15
-
16
-
17
-
18
-
19
-
 20
20 -
 21
21 -
 22
22 -
 23
23 -
 24
24 -
 25
25 -
 26
26 -
 27
27 -
 28
28 -
 29
29 -
 30
30 -
 31
31 -
 32
32 -
 33
33 -
 34
34 -
 35
35 -
 36
36 -
 37
37 -
 38
38 -
 39
39 -
 40
40 -
41
-
42
-
43
-
44
-
45
-
46
-
47
-
48
-
49
-
50
-
51
-
52
-
53
-
54
-
55
-
56
-
57
-
58
-
59
-
60
-
61
-
62
-
63
-
64
-
65
-
66
-
67
-
68
-
69
-
70
-
71
-
72
-
73
-
74
-
75
-
76
-
77
-
78
-
79
-
80
-
81
-
82
-
83
-
84
-
85
-
86
-
87
 |
 |
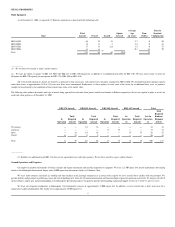
ITEM 6. SELECTED
CONSOLIDATED FINANCIAL INFORMATION AND OPERATING STATISTICS
The following selected financial data and operating statistics should be read in conjunction with
“
MANAGEMENT
’S DISCUSSION AND ANALYSIS OF FINANCIAL
CONDITION AND RESULTS OF OPERATIONS”,
and the consolidated financial statements and related notes included elsewhere in the Form 10
-K.
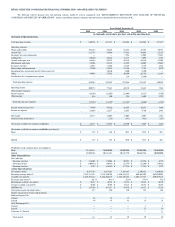
Years Ended December 31,
2004
2003
2002
2001
2000
(in thousands, except share, per share and airline operating data)
Statement of Operations Data:
Total operating revenues
$
540,736
$
421,115
$
315,462
$
238,644
$
147,477
Operating expenses:
Wages and benefits
101,161
76,428
52,542
45,107
30,782
Aircraft fuel
112,795
76,030
57,416
39,042
22,192
Passenger fees and commissions
—
—
1,958
11,065
12,883
Landing fees
20,160
16,128
11,115
7,091
3,753
Aircraft and engine rent
66,464
59,319
56,165
46,160
22,903
Maintenance and repair
54,306
42,151
34,594
34,069
19,667
Insurance and taxes
12,072
11,680
15,465
5,710
2,822
Depreciation and amortization
33,940
23,439
11,768
7,783
4,110
Impairment loss and accrued aircraft return costs(1)(2)
10,160
3,800
8,100
—
Other
39,085
27,962
30,309
26,710
21,143
Stabilization Act (compensation) expense
—
—
154
(7,640
)
—
Total operating expenses
439,983
343,297
275,286
223,197
140,255
Operating income
100,753
77,818
40,176
15,447
7,222
Other income (expense):
Interest expense
(28,109
)
(22,052
)
(12,044
)
(6,227
)
(3,550
)
Other income
816
560
526
1,607
1,792
Total other income (expense)
(27,293
)
(21,492
)
(11,518
)
(4,620
)
(1,758
)
Income before income taxes
73,460
56,326
28,658
10,827
5,464
Income tax expense
28,689
22,277
11,655
4,760
2,942
Net income
44,771
34,049
17,003
6,067
2,522
Preferred stock dividends(3)
(170
)
(413
)
(418
)
(255
)
Net income available for common stockholders
$
44,771
$
33,879
$
16,590
$
5,649
$
2,267
Net income available for common stockholders per share(4):
Basic
$
1.92
$
1.69
$
0.83
$
0.28
$
0.11
Diluted
$
1.87
$
1.63
$
0.80
$
0.27
$
0.11
Weighted average common shares outstanding(4):
Basic
23,349,613
20,000,000
20,000,000
20,000,000
20,000,000
Diluted
23,906,762
20,841,415
20,832,750
20,689,886
20,000,000
Other Financial Data:
Net cash from:
Operating activities
$
116,206
$
93,061
$
50,857
$
22,956
$
6,710
Investing activities
$
(100,828
)
$
(30,443
)
$
(32,979
)
$
(12,690
)
$
(10,812
)
Financing activities
$
9,307
$
(44,482
)
$
(17,751
)
$
(7,383
)
$
3,975
Airline Operating Data:
Passengers carried
6,267,761
4,625,381
3,365,687
2,240,822
1,280,884
Revenue passenger miles(5)
2,953,311,412
2,219,350,701
1,446,534,152
880,569,802
463,050,021
Available seat miles(6)
4,425,391,124
3,464,206,178
2,348,376,444
1,649,171,823
869,629,172
Passenger load factor(7)
66.7
%
64.1
%
61.6
%
53.4
%
53.2
%
Revenue per available seat mile(8)
$
0.122
$
0.122
$
0.134
$
0.145
$
0.170
Cost per available seat mile(9)
$
0.106
$
0.105
$
0.122
$
0.139
$
0.165
EBITDA(10)
$
135,509
$
101,817
$
52,470
$
24,837
$
13,124
Average passenger trip length (miles)
471
480
430
393
362
Number of aircraft in service (end of period):
Embraer Regional Jets:
Owned
62
38
18
7
—
Leased
49
45
41
38
18
Saab Turboprops(11):
Owned
—
—
—
2
2
Leased
—
—
—
23
24
Jetstream 31 (Leased)
—
—
—
—
15
Total aircraft
111
83
59
70
59