Family Dollar 2011 Annual Report Download - page 67
Download and view the complete annual report
Please find page 67 of the 2011 Family Dollar annual report below. You can navigate through the pages in the report by either clicking on the pages listed below, or by using the keyword search tool below to find specific information within the annual report.-
 1
1 -
2
-
3
-
4
-
5
-
6
-
7
-
8
-
9
-
10
-
11
-
12
-
13
-
14
-
15
-
16
-
17
-
18
-
19
-
20
-
21
-
22
-
23
-
24
-
25
-
26
-
27
-
28
-
29
-
30
-
31
-
32
-
33
-
34
-
35
-
36
-
37
-
38
-
39
-
40
-
41
-
42
-
43
-
44
-
45
-
46
-
47
-
48
-
49
-
50
-
51
-
52
-
53
-
54
-
55
-
56
-
 57
57 -
 58
58 -
 59
59 -
 60
60 -
 61
61 -
 62
62 -
 63
63 -
 64
64 -
 65
65 -
 66
66 -
 67
67 -
 68
68 -
 69
69 -
 70
70 -
 71
71 -
 72
72 -
 73
73 -
 74
74 -
 75
75 -
 76
76 -
 77
77 -
78
-
79
-
80
 |
 |

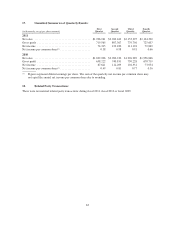
17. Unaudited Summaries of Quarterly Results:
(in thousands, except per share amounts)
First
Quarter
Second
Quarter
Third
Quarter
Fourth
Quarter
2011
Net sales ....................................... $1,996,941 $2,263,169 $2,153,395 $2,134,330
Gross profit ..................................... 719,565 807,367 779,756 725,607
Net income ..................................... 74,315 123,180 111,101 79,849
Net income per common share(1) ..................... 0.58 0.98 0.91 0.66
2010
Net sales ....................................... $1,822,906 $2,090,230 $1,996,989 $1,956,846
Gross profit ..................................... 658,222 740,831 730,228 678,719
Net income ..................................... 67,621 112,209 104,351 73,954
Net income per common share(1) ..................... 0.49 0.81 0.77 0.56
(1) Figures represent diluted earnings per share. The sum of the quarterly net income per common share may
not equal the annual net income per common share due to rounding.
18. Related Party Transactions:
There were no material related party transactions during fiscal 2011, fiscal 2010 or fiscal 2009.
63