Family Dollar 2011 Annual Report Download - page 30
Download and view the complete annual report
Please find page 30 of the 2011 Family Dollar annual report below. You can navigate through the pages in the report by either clicking on the pages listed below, or by using the keyword search tool below to find specific information within the annual report.-
 1
1 -
2
-
3
-
4
-
5
-
6
-
7
-
8
-
9
-
10
-
11
-
12
-
13
-
14
-
15
-
16
-
17
-
18
-
19
-
 20
20 -
 21
21 -
 22
22 -
 23
23 -
 24
24 -
 25
25 -
 26
26 -
 27
27 -
 28
28 -
 29
29 -
 30
30 -
 31
31 -
 32
32 -
 33
33 -
 34
34 -
 35
35 -
 36
36 -
 37
37 -
 38
38 -
 39
39 -
 40
40 -
41
-
42
-
43
-
44
-
45
-
46
-
47
-
48
-
49
-
50
-
51
-
52
-
53
-
54
-
55
-
56
-
57
-
58
-
59
-
60
-
61
-
62
-
63
-
64
-
65
-
66
-
67
-
68
-
69
-
70
-
71
-
72
-
73
-
74
-
75
-
76
-
77
-
78
-
79
-
80
 |
 |

strategic initiatives, as well as continued benefits from operational improvements over the past several years. We
expect sales will continue to be strongest in the Consumables category, as customers continue to constrain their
discretionary spending in response to continued economic pressure. We expect cost of sales, as a percentage of
net sales, will be approximately flat. We expect that the adverse impact of stronger sales of lower margin
consumables and higher freight costs will be mitigated by the expected benefits of private brands and global
sourcing. We expect SG&A expenses to decrease as a percentage of net sales as a result of our comparable store
sales growth and continued productivity improvements, which we expect will offset increased expense pressure
from our aggressive investment agenda.
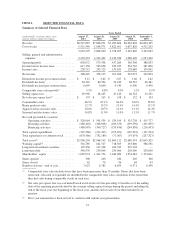
Results of Operations
Our results of operations for fiscal 2011, fiscal 2010 and fiscal 2009 are highlighted in the table below and
discussed in the following paragraphs:
Years Ended
(in thousands) August 27, 2011 August 28, 2010 August 29, 2009
Net sales .................................. $8,547,835 $7,866,971 $7,400,606
Cost and expenses:
Cost of sales ........................... 5,515,540 5,058,971 4,822,401
% of net sales ...................... 64.5% 64.3% 65.2%
Selling, general and administrative ......... 2,394,223 2,232,402 2,120,936
% of net sales ...................... 28.0% 28.4% 28.7%
Cost of sales and operating expenses ............ 7,909,763 7,291,373 6,943,337
% of net sales .......................... 92.5% 92.7% 93.8%
Operating profit ............................ 638,072 575,598 457,269
% of net sales .......................... 7.5% 7.3% 6.2%
Investment income .......................... 1,532 1,597 6,595
% of net sales .......................... 0.0% 0.0% 0.1%
Interest expense ............................ 22,446 13,337 12,939
% of net sales .......................... 0.3% 0.2% 0.2%
Income before income taxes .................. 617,158 563,858 450,925
% of net sales .......................... 7.2% 7.2% 6.1%
Income taxes .............................. 228,713 205,723 159,659
% of net sales .......................... 2.7% 2.6% 2.2%
Net Income ................................ $ 388,445 $ 358,135 $ 291,266
% of net sales .......................... 4.5% 4.6% 3.9%
Net Sales
Net sales increased 8.7% in fiscal 2011 compared to fiscal 2010, and 6.3% in fiscal 2010 compared to fiscal
2009. The net sales increases in fiscal 2011 and fiscal 2010 reflect increases in comparable store sales of 5.5%
and 4.8%, respectively, with the balance of the increases due primarily to sales from new stores opened as part of
our store growth program. Comparable store sales include stores that have been open more than 13 months.
Stores that have been renovated, relocated or expanded are included in the comparable store sales calculation to
the extent that they had sales during comparable weeks in each year. The method of calculating comparable store
sales varies across the retail industry. As a result, our comparable store sales calculation may not be comparable
to similarly titled measures reported by other companies.
The 5.5% increase in comparable store sales in fiscal 2011 resulted from increases in both customer traffic,
as measured by the number of register transactions, and the dollar value of the average customer transaction.
26