Family Dollar 2011 Annual Report Download - page 12
Download and view the complete annual report
Please find page 12 of the 2011 Family Dollar annual report below. You can navigate through the pages in the report by either clicking on the pages listed below, or by using the keyword search tool below to find specific information within the annual report.-
 1
1 -
 2
2 -
 3
3 -
 4
4 -
 5
5 -
 6
6 -
 7
7 -
 8
8 -
 9
9 -
 10
10 -
 11
11 -
 12
12 -
 13
13 -
 14
14 -
 15
15 -
 16
16 -
 17
17 -
 18
18 -
 19
19 -
 20
20 -
 21
21 -
 22
22 -
23
-
24
-
25
-
26
-
27
-
28
-
29
-
30
-
31
-
32
-
33
-
34
-
35
-
36
-
37
-
38
-
39
-
40
-
41
-
42
-
43
-
44
-
45
-
46
-
47
-
48
-
49
-
50
-
51
-
52
-
53
-
54
-
55
-
56
-
57
-
58
-
59
-
60
-
61
-
62
-
63
-
64
-
65
-
66
-
67
-
68
-
69
-
70
-
71
-
72
-
73
-
74
-
75
-
76
-
77
-
78
-
79
-
80
 |
 |

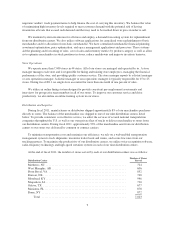
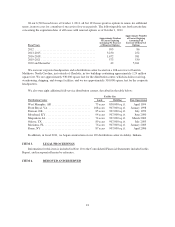
Our stores offer a variety of general merchandise. The following table summarizes the percentage of net
sales attributable to each product category over the last three fiscal years.
Product Category 2011 2010 2009
Consumables .................................................... 66.5% 65.1% 64.4%
Home Products ................................................... 12.7% 13.2% 13.4%
Apparel and Accessories ........................................... 10.0% 10.7% 11.2%
Seasonal and Electronics ........................................... 10.8% 11.0% 11.0%
The following table describes our product categories in more detail.
Consumables .............. Household chemicals
Paper products
Food
Health and beauty aids
Hardware and automotive supplies
Pet food and supplies
Home Products ............ Domestics, including blankets, sheets and towels
Housewares
Giftware
Home décor
Apparel and Accessories .... Men’s clothing
Women’s clothing
Boys’ and girls’ clothing
Infants’ clothing
Shoes
Fashion accessories
Seasonal and Electronics .... Toys
Stationery and school supplies
Seasonal goods
Personal electronics, including pre-paid cellular phones and services
Reflecting trends in customer demand over the past three fiscal years, we have expanded our assortment of
consumable merchandise in our stores. During fiscal 2011, we expanded the number of basic SKUs in our stores,
primarily in food and health and beauty aids, by 20-25%. During fiscal 2011, nationally advertised brand name
merchandise accounted for approximately 53% of sales. Merchandise sold under our private brands program,
across all merchandise categories, accounted for approximately 25% of sales. Merchandise sold under other
brands and labels, or which was unlabeled, accounted for the balance of sales. During fiscal 2011, closeout
merchandise accounted for approximately 1% of sales.
We purchase merchandise from a wide variety of suppliers and generally have not experienced difficulty in
obtaining adequate quantities of merchandise. In fiscal 2011, no single supplier accounted for more than 8% of
the merchandise we sold.
In fiscal 2011, approximately 31% of our purchased merchandise (at cost) was manufactured overseas. We
imported approximately 11% of our merchandise purchases (at cost) during fiscal 2011 and relied on domestic
suppliers for approximately 20% of our purchased merchandise (at cost). While most of our merchandise is
shipped to our distribution centers from domestic suppliers, a substantial amount of such merchandise is
manufactured outside the United States and imported by the domestic suppliers. Our vendor arrangements
provide for payment in U.S. dollars.
We maintain a substantial variety and depth of merchandise inventory in stock in our stores (and in our
distribution centers for weekly store replenishment) to attract customers and meet their shopping needs. We
8