Family Dollar 2011 Annual Report Download - page 65
Download and view the complete annual report
Please find page 65 of the 2011 Family Dollar annual report below. You can navigate through the pages in the report by either clicking on the pages listed below, or by using the keyword search tool below to find specific information within the annual report.-
 1
1 -
2
-
3
-
4
-
5
-
6
-
7
-
8
-
9
-
10
-
11
-
12
-
13
-
14
-
15
-
16
-
17
-
18
-
19
-
20
-
21
-
22
-
23
-
24
-
25
-
26
-
27
-
28
-
29
-
30
-
31
-
32
-
33
-
34
-
35
-
36
-
37
-
38
-
39
-
40
-
41
-
42
-
43
-
44
-
45
-
46
-
47
-
48
-
49
-
50
-
51
-
52
-
53
-
54
-
 55
55 -
 56
56 -
 57
57 -
 58
58 -
 59
59 -
 60
60 -
 61
61 -
 62
62 -
 63
63 -
 64
64 -
 65
65 -
 66
66 -
 67
67 -
 68
68 -
 69
69 -
 70
70 -
 71
71 -
 72
72 -
 73
73 -
 74
74 -
 75
75 -
76
-
77
-
78
-
79
-
80
 |
 |

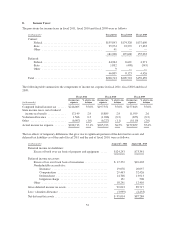
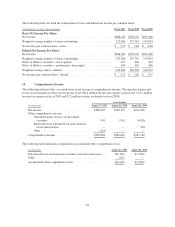
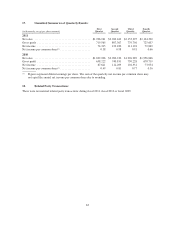
The following table sets forth the computation of basic and diluted net income per common share:
(in thousands, except per share amounts) Fiscal 2011 Fiscal 2010 Fiscal 2009
Basic Net Income Per Share:
Net income ..................................................... $388,445 $358,135 $291,266
Weighted average number of shares outstanding ....................... 123,360 135,745 139,894
Net income per common share—basic ............................... $ 3.15 $ 2.64 $ 2.08
Diluted Net Income Per Share:
Net income ..................................................... $388,445 $358,135 $291,266
Weighted average number of shares outstanding ....................... 123,360 135,745 139,894
Effect of dilutive securities—stock options ............................ 677 406 262
Effect of dilutive securities—performance share rights .................. 449 445 366
Weighted average shares—diluted .................................. 124,486 136,596 140,522
Net income per common share—diluted .............................. $ 3.12 $ 2.62 $ 2.07
15. Comprehensive Income:
The following table provides a reconciliation of net income to comprehensive income. The unrealized gains and
losses on investment securities are shown net of tax ($0.6 million income tax expense in fiscal 2011, $1.2 million
income tax expense in fiscal 2010 and $2.5 million income tax benefit in fiscal 2009).
Years Ended
(in thousands) August 27, 2011 August 28, 2010 August 29, 2009
Net income ................................ $388,445 $358,135 $291,266
Other comprehensive income:
Unrealized gains (losses) on investment
securities ........................... 904 1,914 (4,626)
Reclassification adjustment for gains realized
in net other income .................... — — 528
Other ................................ (261) — —
Comprehensive income ...................... $389,088 $360,049 $287,168
The following table details the components of accumulated other comprehensive loss.
(in thousands) August 27, 2011 August 28, 2010
Unrealized losses on investment securities (net of income taxes) . . . $(6,142) $(7,046)
Other .................................................. (261) —
Accumulated other comprehensive loss ....................... $(6,403) $(7,046)
61