Family Dollar 2011 Annual Report Download - page 25
Download and view the complete annual report
Please find page 25 of the 2011 Family Dollar annual report below. You can navigate through the pages in the report by either clicking on the pages listed below, or by using the keyword search tool below to find specific information within the annual report.-
 1
1 -
2
-
3
-
4
-
5
-
6
-
7
-
8
-
9
-
10
-
11
-
12
-
13
-
14
-
 15
15 -
 16
16 -
 17
17 -
 18
18 -
 19
19 -
 20
20 -
 21
21 -
 22
22 -
 23
23 -
 24
24 -
 25
25 -
 26
26 -
 27
27 -
 28
28 -
 29
29 -
 30
30 -
 31
31 -
 32
32 -
 33
33 -
 34
34 -
 35
35 -
36
-
37
-
38
-
39
-
40
-
41
-
42
-
43
-
44
-
45
-
46
-
47
-
48
-
49
-
50
-
51
-
52
-
53
-
54
-
55
-
56
-
57
-
58
-
59
-
60
-
61
-
62
-
63
-
64
-
65
-
66
-
67
-
68
-
69
-
70
-
71
-
72
-
73
-
74
-
75
-
76
-
77
-
78
-
79
-
80
 |
 |

PART II
ITEM 5. MARKET FOR REGISTRANT’S COMMON EQUITY, RELATED STOCKHOLDER
MATTERS AND ISSUER PURCHASES OF EQUITY SECURITIES
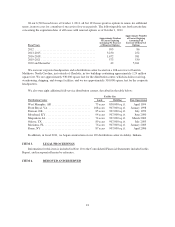
Our common stock is traded on the NYSE under the ticker symbol FDO. At October 1, 2011, there were
approximately 2,701 holders of record of our common stock. The accompanying tables give the high and low
sales prices of our common stock and the dividends declared per share for each quarter of fiscal 2011 and fiscal
2010. We expect that dividends will continue to be declared quarterly for the foreseeable future.
Market Prices and Dividends
2011 High Low Dividend
First Quarter ......................................................... $51.13 $42.15 $.15 1/2
Second Quarter ....................................................... 55.62 41.31 .18
Third Quarter ........................................................ 56.92 48.95 .18
Fourth Quarter ....................................................... 56.25 44.42 .18
2010 High Low Dividend
First Quarter ......................................................... $31.63 $25.52 $.13 1/2
Second Quarter ....................................................... 33.57 27.15 .15 1/2
Third Quarter ........................................................ 42.07 32.30 .15 1/2
Fourth Quarter ....................................................... 44.03 35.31 .15 1/2
Issuer Purchases of Equity Securities
The following table sets forth information with respect to purchases of shares of our common stock made
during the quarter ended August 27, 2011, by us, on our behalf or by any “affiliated purchaser” as defined by
Rule 10b-18(a)(3) of the Exchange Act.
Period
Total Number of
Shares Purchased
Average Price
Paid per Share
Total Number of
Shares Purchased
as Part of Publicly
Announced Plans
or Programs(1)
Maximum Number of
Shares that May Yet Be
Purchased Under the
Plans or Programs(1)(2)
June (5/29/11-7/2/11) .............. 117,442 $52.83 117,442 4,426,543
July (7/3/11-7/30/11) .............. 1,266,600 52.86 1,266,600 3,240,709
August (7/31/11-8/27/11) ........... 1,637,000 51.80 1,637,000 1,836,334
Total ....................... 3,021,042 $52.28 3,021,042 1,836,334
(1) On September 29, 2010, we announced that the Board of Directors authorized the purchase of up to $750
million of our outstanding common stock. There was $87.3 million remaining under this authorization as of
August 27, 2011.
(2) Remaining dollar amounts are converted to shares using the closing stock price as of the end of the fiscal
month.
The stock repurchases in the table above include both open market purchases and purchases made in
connection with structured repurchase agreements. See Note 12 to the Consolidated Financial Statements
included in this Report for more information.
Additionally note that the table above does not include the Board authorization announced on September 28,
2011, to purchase up to an additional $250 million of our common stock.
21