Family Dollar 2011 Annual Report Download - page 53
Download and view the complete annual report
Please find page 53 of the 2011 Family Dollar annual report below. You can navigate through the pages in the report by either clicking on the pages listed below, or by using the keyword search tool below to find specific information within the annual report.-
 1
1 -
2
-
3
-
4
-
5
-
6
-
7
-
8
-
9
-
10
-
11
-
12
-
13
-
14
-
15
-
16
-
17
-
18
-
19
-
20
-
21
-
22
-
23
-
24
-
25
-
26
-
27
-
28
-
29
-
30
-
31
-
32
-
33
-
34
-
35
-
36
-
37
-
38
-
39
-
40
-
41
-
42
-
 43
43 -
 44
44 -
 45
45 -
 46
46 -
 47
47 -
 48
48 -
 49
49 -
 50
50 -
 51
51 -
 52
52 -
 53
53 -
 54
54 -
 55
55 -
 56
56 -
 57
57 -
 58
58 -
 59
59 -
 60
60 -
 61
61 -
 62
62 -
 63
63 -
64
-
65
-
66
-
67
-
68
-
69
-
70
-
71
-
72
-
73
-
74
-
75
-
76
-
77
-
78
-
79
-
80
 |
 |

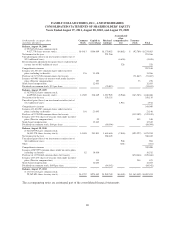
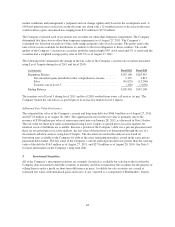
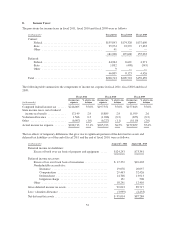
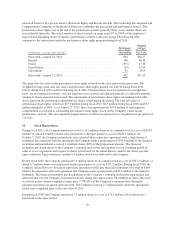
The Company’s investments consisted of the following available-for-sale securities at the end of fiscal 2011 and
fiscal 2010 (in thousands):
August 27, 2011 Amortized Cost
Gross
Unrealized
Holding
Gains
Gross
Unrealized
Holding
Losses Fair Value
Auction rate securities ............................... $116,925 — 9,317(1) $107,608
Variable rate demand notes ............................ 42,299 — — 42,299
Municipal debt securities ............................. 51,125 273 — 51,398
Corporate debt securities ............................. 941 9 — 950
Equity securities .................................... 1,979 — 770 1,209
(1) The gross unrealized holding losses for fiscal 2011 were in a continuous unrealized loss position for 12
months or longer.
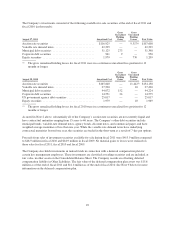
August 28, 2010 Amortized Cost
Gross
Unrealized
Holding
Gains
Gross
Unrealized
Holding
Losses Fair Value
Auction rate securities ............................... $165,600 — 11,442(1) $154,158
Variable rate demand notes ............................ 27,500 — 10 27,490
Municipal debt securities ............................. 44,072 152 — 44,224
Corporate debt securities ............................. 14,551 24 — 14,575
US government agency debt securities ................... 25,017 — — 25,017
Equity securities .................................... 1,979 — 10 1,969
(1) The gross unrealized holding losses for fiscal 2010 were in a continuous unrealized loss position for 12
months or longer.
As noted in Note 2 above, substantially all of the Company’s auction rate securities are not currently liquid and
have contractual maturities ranging from 15 years to 46 years. The Company’s other debt securities include
municipal bonds, variable-rate demand notes, agency bonds, discount notes, and commercial paper, and have
weighted average maturities of less than one year. While the variable rate demand notes have underlying
contractual maturities beyond one year, the securities are traded in the short-term as a result of 7-day put options.
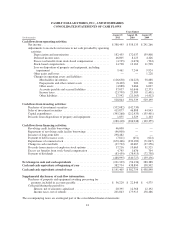
Proceeds from sales of investment securities available-for-sale during fiscal 2011 were $415.9 million compared
to $46.9 million in fiscal 2010 and $44.9 million in fiscal 2009. No material gains or losses were realized on
those sales for fiscal 2011, fiscal 2010 and fiscal 2009.
The Company also holds investments in mutual funds in connection with a deferred compensation plan for
certain key management employees. These investments are classified as trading securities and are included, at
fair value, in other assets on the Consolidated Balance Sheet. The Company records an offsetting deferred
compensation liability in Other Liabilities. The fair value of the deferred compensation plan assets was $15.6
million as of the end of fiscal 2011 and $11.4 million as of the end of fiscal 2010. See Note 9 below for more
information on the deferred compensation plan.
49