Family Dollar 2011 Annual Report Download - page 50
Download and view the complete annual report
Please find page 50 of the 2011 Family Dollar annual report below. You can navigate through the pages in the report by either clicking on the pages listed below, or by using the keyword search tool below to find specific information within the annual report.-
 1
1 -
2
-
3
-
4
-
5
-
6
-
7
-
8
-
9
-
10
-
11
-
12
-
13
-
14
-
15
-
16
-
17
-
18
-
19
-
20
-
21
-
22
-
23
-
24
-
25
-
26
-
27
-
28
-
29
-
30
-
31
-
32
-
33
-
34
-
35
-
36
-
37
-
38
-
39
-
 40
40 -
 41
41 -
 42
42 -
 43
43 -
 44
44 -
 45
45 -
 46
46 -
 47
47 -
 48
48 -
 49
49 -
 50
50 -
 51
51 -
 52
52 -
 53
53 -
 54
54 -
 55
55 -
 56
56 -
 57
57 -
 58
58 -
 59
59 -
 60
60 -
61
-
62
-
63
-
64
-
65
-
66
-
67
-
68
-
69
-
70
-
71
-
72
-
73
-
74
-
75
-
76
-
77
-
78
-
79
-
80
 |
 |

comprehensive income under current accounting guidance. The new guidance is effective for fiscal year and
interim periods beginning after December 15, 2011. The Company will adopt this guidance in the third quarter of
fiscal 2012. The adoption of ASU 2011-05 is not expected to have a material impact on the Company’s
Consolidated Financial Statements.
2. Fair Value Measurements:
Fair value accounting standards define fair value as the price that would be received to sell an asset or paid to
transfer a liability in an orderly transaction between market participants at the measurement date. The following
fair value hierarchy prioritizes the inputs used to measure fair value into three levels, with Level 1 being of the
highest priority.
• Level 1—Quoted prices in active markets for identical assets or liabilities.
• Level 2—Inputs other than quoted prices included within Level 1 that are observable for the asset or
liability, either directly or indirectly, such as quoted prices for similar assets or liabilities in active
markets, quoted prices for identical or similar assets or liabilities in markets that are not active, inputs
other than quoted prices that are observable for the asset or liability, or inputs that are derived
principally from or corroborated by observable market data by correlation or other means.
• Level 3—Inputs that are unobservable for the asset or liability.
The unobservable inputs in Level 3 can only be used to measure fair value to the extent that observable inputs in
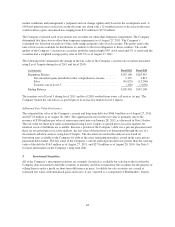
Level 1 and Level 2 are not available. The following table represents the Company’s fair value hierarchy as of
August 27, 2011, and August 28, 2010, for items that are required to be measured at fair value on a recurring
basis:
August 27, 2011
(in thousands) Fair Value Level 1 Level 2 Level 3
Cash equivalents:
Money market funds ..................... $ 77,842 $ 77,842 $ — $ —
Investment securities:
Auction rate securities .................... 107,608 — 150 107,458
Variable rate demand notes ................ 42,299 42,299 — —
Municipal debt securities ................. 51,398 — 51,398 —
Corporate debt securities .................. 950 — 950 —
Equity securities ........................ 1,209 1,209 — —
Other assets:
Mutual funds(1) ......................... 15,580 15,580 — —
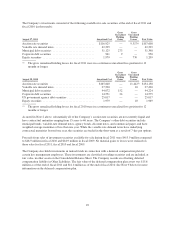
August 28, 2010
(in thousands) Fair Value Level 1 Level 2 Level 3
Cash equivalents:
Money market funds ..................... $287,003 $287,003 $ — $ —
Investment securities:
Auction rate securities .................... 154,158 — 7,050 147,108
Variable rate demand notes ................ 27,490 27,490 — —
Municipal debt securities ................. 44,224 — 44,224 —
Corporate debt securities .................. 14,575 11,996 2,579 —
US government agency debt securities ....... 25,017 25,017 — —
Equity securities ........................ 1,969 1,969 — —
Other assets:
Mutual funds(1) ......................... 11,402 11,402 — —
(1) Represents assets held pursuant to a deferred compensation plan for certain key management
employees.
46