Family Dollar 2011 Annual Report Download - page 52
Download and view the complete annual report
Please find page 52 of the 2011 Family Dollar annual report below. You can navigate through the pages in the report by either clicking on the pages listed below, or by using the keyword search tool below to find specific information within the annual report.-
 1
1 -
2
-
3
-
4
-
5
-
6
-
7
-
8
-
9
-
10
-
11
-
12
-
13
-
14
-
15
-
16
-
17
-
18
-
19
-
20
-
21
-
22
-
23
-
24
-
25
-
26
-
27
-
28
-
29
-
30
-
31
-
32
-
33
-
34
-
35
-
36
-
37
-
38
-
39
-
40
-
41
-
 42
42 -
 43
43 -
 44
44 -
 45
45 -
 46
46 -
 47
47 -
 48
48 -
 49
49 -
 50
50 -
 51
51 -
 52
52 -
 53
53 -
 54
54 -
 55
55 -
 56
56 -
 57
57 -
 58
58 -
 59
59 -
 60
60 -
 61
61 -
 62
62 -
63
-
64
-
65
-
66
-
67
-
68
-
69
-
70
-
71
-
72
-
73
-
74
-
75
-
76
-
77
-
78
-
79
-
80
 |
 |

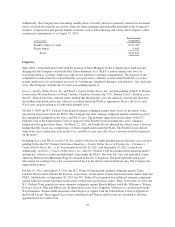
market conditions and management’s judgment and can change significantly based on the assumptions used. A
100 basis point increase or decrease in the discount rate along with a 12-month increase or decrease in the term
could result in a gross unrealized loss ranging from $3.9 million to $17.0 million.
The Company evaluated each of its auction rate securities for other-than-temporary impairment. The Company
determined that there was no other-than-temporary impairment as of August 27, 2011. The Company’s
evaluation was based on an analysis of the credit rating and parity ratio of each security. The parity ratio is the
ratio of trust assets available for distribution to creditors to the trust obligations to those creditors. The credit
quality of the Company’s auction rate securities portfolio remains high (95% AAA rated and 5% A rated) and the
securities had a weighted average parity ratio of 109.5% as of August 27, 2011.
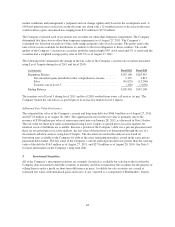
The following table summarizes the change in the fair value of the Company’s auction rate securities measured
using Level 3 inputs during fiscal 2011 and fiscal 2010:
(in thousands) Fiscal 2011 Fiscal 2010
Beginning Balance .............................................. $147,108 $163,545
Net unrealized gains included in other comprehensive income ........ 2,125 3,813
Sales ..................................................... (41,625) (13,200)
Transfers out of Level 3 ...................................... (150) (7,050)
Ending Balance ................................................. $107,458 $147,108
The transfers out of Level 3 during fiscal 2011 and fiscal 2010 resulted from issuer call notices (at par). The
Company treated the call notices as quoted prices in an inactive market (Level 2 inputs).
Additional Fair Value Disclosures
The estimated fair value of the Company’s current and long-term debt was $566.0 million as of August 27, 2011,
and $277.8 million as of August 28, 2010. The significant increase in the fair value is primarily due to the
issuance of $300 million par value of senior unsecured notes on January 28, 2011, as discussed in Note 5 below.
The fair value for these new notes is determined using Level 1 inputs as quoted prices in active markets for
identical assets or liabilities are available. Because a portion of the Company’s debt was a private placement and
there are no quoted prices in active markets, the fair value of that portion was determined through the use of a
discounted cash flow analysis using Level 3 inputs. The discount rate used in the analysis was based on
borrowing rates available to the Company for debt of the same remaining maturities, issued in the same private
placement debt market. The fair value of the Company’s current and long-term debt was greater than the carrying
value of the debt by $16.0 million as of August 27, 2011, and $27.8 million as of August 28, 2010. See Note 5
for more information on the Company’s long-term debt.
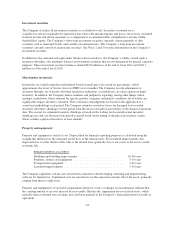
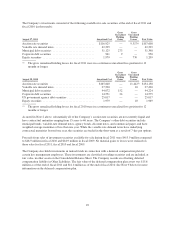
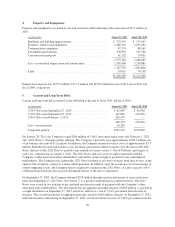
3. Investment Securities:
All of the Company’s investment securities are currently classified as available-for-sale due to the fact that the
Company does not intend to hold the securities to maturity and does not purchase the securities for the purpose of
selling them to make a profit on short-term differences in price. Available-for-sale securities are carried at
estimated fair value, with unrealized gains and losses, if any, reported as a component of Shareholders’ Equity.
48