Family Dollar 2011 Annual Report Download - page 34
Download and view the complete annual report
Please find page 34 of the 2011 Family Dollar annual report below. You can navigate through the pages in the report by either clicking on the pages listed below, or by using the keyword search tool below to find specific information within the annual report.-
 1
1 -
2
-
3
-
4
-
5
-
6
-
7
-
8
-
9
-
10
-
11
-
12
-
13
-
14
-
15
-
16
-
17
-
18
-
19
-
20
-
21
-
22
-
23
-
 24
24 -
 25
25 -
 26
26 -
 27
27 -
 28
28 -
 29
29 -
 30
30 -
 31
31 -
 32
32 -
 33
33 -
 34
34 -
 35
35 -
 36
36 -
 37
37 -
 38
38 -
 39
39 -
 40
40 -
 41
41 -
 42
42 -
 43
43 -
 44
44 -
45
-
46
-
47
-
48
-
49
-
50
-
51
-
52
-
53
-
54
-
55
-
56
-
57
-
58
-
59
-
60
-
61
-
62
-
63
-
64
-
65
-
66
-
67
-
68
-
69
-
70
-
71
-
72
-
73
-
74
-
75
-
76
-
77
-
78
-
79
-
80
 |
 |
compared to 200 new stores during fiscal 2010. The increase in capital expenditures during fiscal 2010 as
compared to fiscal 2009 was due primarily to the investments we made to drive revenues, including
improvements and upgrades to existing stores, distribution center improvements and technology-related projects.
Capital expenditures for fiscal 2012 are expected to be between $550 and $600 million. The planned
increase in capital expenditures in fiscal 2012 is due primarily to our efforts to support new store openings,
execute our comprehensive store renovation program and invest in our distribution network. In fiscal 2012, we
expect to increase the number of stores we own through the initial construction of stores as we look to leverage
our lower cost of capital compared to the developers’ higher rate and reduce our effective cost of ownership.
Also, in fiscal 2012, we expect to renovate, relocate or expand more than 1,000 stores. We also plan to complete
construction of our 10th distribution center and begin construction of our 11th distribution center.
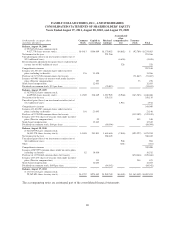
During fiscal 2011, we purchased 13.9 million shares of our common stock at a cost of $670.5 million,
compared to 9.4 million shares at a cost of $332.2 million in fiscal 2010, and 2.3 million shares at a cost of $71.1
million in fiscal 2009. On September 28, 2011, the Company announced that the Board of Directors authorized
the Company to purchase up to an additional $250 million of the Company’s outstanding common stock. As
such, after the announcement, the Company had $337.3 million remaining under current authorizations.
The timing and amount of any shares repurchased have been and will continue to be determined by
management based on its evaluation of market conditions and other factors. Our share repurchase programs do
not have a stated expiration date, and purchases may be made through open market purchases, private market
transactions or other structured transactions.
Our wholly-owned captive insurance subsidiary maintains certain balances in cash and cash equivalents and
investment securities that are used in connection with our retained workers’ compensation, general liability and
automobile liability risks and are not designated for general corporate purposes. As of the end of fiscal 2011,
these cash and cash equivalents and investment securities balances were $53.2 million, and $93.0 million,
respectively.
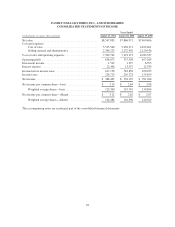
Cash Flows from Operating Activities
Cash provided by operating activities decreased $63.5 million during fiscal 2011, as compared to fiscal
2010. The decrease was due primarily to an increase in merchandise inventories primarily offset by changes in
other liabilities and higher net income, all in the ordinary course of business.
Cash provided by operating activities increased $62.3 million during fiscal 2010, as compared to fiscal
2009. The increase was due primarily to an increase in net income. An increase in our merchandise inventories
was offset by an increase in accounts payable and accrued liabilities and changes in our income tax receivable/
payable amounts, all in the ordinary course of business.
Cash Flows from Investing Activities
Cash used in investing activities decreased $26.5 million during fiscal 2011, as compared to fiscal 2010. The
change was due primarily to a net increase in sales of investment securities in fiscal 2011, as compared to fiscal
2010, offset by an increase in capital expenditures of $132.8 million. The net increase in sales of investment
securities was due to the continued liquidation of our auction rate securities and the increase in capital
expenditures as discussed above.
Cash used in investing activities increased $197.6 million during fiscal 2010, as compared to fiscal 2009.
The increase was due to an increase in purchases of investment securities and an increase in capital expenditures.
We purchased $142.7 million of investment securities during fiscal 2010, compared to no purchases during fiscal
2009. Due to volatility in the financial markets and the liquidity issues surrounding our auction rate securities, we
did not purchase any investment securities during fiscal 2009 and only liquidated $44.9 million of investment
securities.
30