Family Dollar 2011 Annual Report Download - page 66
Download and view the complete annual report
Please find page 66 of the 2011 Family Dollar annual report below. You can navigate through the pages in the report by either clicking on the pages listed below, or by using the keyword search tool below to find specific information within the annual report.-
 1
1 -
2
-
3
-
4
-
5
-
6
-
7
-
8
-
9
-
10
-
11
-
12
-
13
-
14
-
15
-
16
-
17
-
18
-
19
-
20
-
21
-
22
-
23
-
24
-
25
-
26
-
27
-
28
-
29
-
30
-
31
-
32
-
33
-
34
-
35
-
36
-
37
-
38
-
39
-
40
-
41
-
42
-
43
-
44
-
45
-
46
-
47
-
48
-
49
-
50
-
51
-
52
-
53
-
54
-
55
-
 56
56 -
 57
57 -
 58
58 -
 59
59 -
 60
60 -
 61
61 -
 62
62 -
 63
63 -
 64
64 -
 65
65 -
 66
66 -
 67
67 -
 68
68 -
 69
69 -
 70
70 -
 71
71 -
 72
72 -
 73
73 -
 74
74 -
 75
75 -
 76
76 -
77
-
78
-
79
-
80
 |
 |

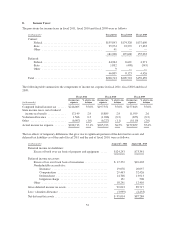
16. Segment Information:
The Company operates a chain of more than 7,000 general merchandise retail discount stores in 44 states, serving
the basic needs of customers primarily in low- and middle-income brackets. The stores are supported by nine
distribution centers and one corporate headquarters. All of the stores operate under the Family Dollar name and
are substantially the same in terms of size, merchandise, customers, distribution and operations. The Company
has no franchised locations or other lines of business. All of the Company’s operations are located in the United
States with the exception of certain sourcing entities located in Asia. The foreign operations are not material. The
Company manages the business on the basis of one operating segment and therefore, has only one reportable
segment. The following table presents net sales by classes of similar products.
Years Ended
(in thousands) August 27, 2011 August 28, 2010 August 29, 2009
Classes of similar products:
Consumables .......................... $5,686,576 $5,119,911 $4,764,835
Home Products ......................... 1,084,480 1,035,944 988,550
Apparel and Accessories ................. 854,602 840,929 831,321
Seasonal and Electronics ................. 922,177 870,187 815,900
Net Sales ......................... $8,547,835 $7,866,971 $7,400,606
The following table describes the Company’s product categories in more detail:
Consumables ............. Household chemicals
Paper products
Food
Health and beauty aids
Hardware and automotive supplies
Pet food and supplies
Home Products ........... Domestics, including blankets, sheets and towels
Housewares
Giftware
Home décor
Apparel and Accessories . . . Men’s clothing
Women’s clothing
Boys’ and girls’ clothing
Infants’ clothing
Shoes
Fashion accessories
Seasonal and Electronics . . . Toys
Stationery and school supplies
Seasonal goods
Personal electronics, including pre-paid cellular phones and services
62