Family Dollar 2011 Annual Report Download - page 56
Download and view the complete annual report
Please find page 56 of the 2011 Family Dollar annual report below. You can navigate through the pages in the report by either clicking on the pages listed below, or by using the keyword search tool below to find specific information within the annual report.-
 1
1 -
2
-
3
-
4
-
5
-
6
-
7
-
8
-
9
-
10
-
11
-
12
-
13
-
14
-
15
-
16
-
17
-
18
-
19
-
20
-
21
-
22
-
23
-
24
-
25
-
26
-
27
-
28
-
29
-
30
-
31
-
32
-
33
-
34
-
35
-
36
-
37
-
38
-
39
-
40
-
41
-
42
-
43
-
44
-
45
-
 46
46 -
 47
47 -
 48
48 -
 49
49 -
 50
50 -
 51
51 -
 52
52 -
 53
53 -
 54
54 -
 55
55 -
 56
56 -
 57
57 -
 58
58 -
 59
59 -
 60
60 -
 61
61 -
 62
62 -
 63
63 -
 64
64 -
 65
65 -
 66
66 -
67
-
68
-
69
-
70
-
71
-
72
-
73
-
74
-
75
-
76
-
77
-
78
-
79
-
80
 |
 |

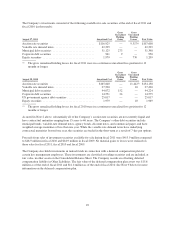
8. Income Taxes:
The provisions for income taxes in fiscal 2011, fiscal 2010 and fiscal 2009 were as follows:
(in thousands) Fiscal 2011 Fiscal 2010 Fiscal 2009
Current:
Federal ......................................... $155,893 $174,328 $137,600
State ........................................... 25,974 23,272 17,633
Other .......................................... 41 — —
181,908 197,600 155,233
Deferred:
Federal ......................................... 44,964 8,621 4,971
State ........................................... 1,832 (498) (545)
Other .......................................... 9 — —
46,805 8,123 4,426
Total ............................................... $228,713 $205,723 $159,659
The following table summarizes the components of income tax expense in fiscal 2011, fiscal 2010 and fiscal
2009:
Fiscal 2011 Fiscal 2010 Fiscal 2009
(in thousands)
Income tax
expense
% of pre-tax
income
Income tax
expense
% of pre-tax
income
Income tax
expense
% of pre-tax
income
Computed federal income tax ...... $216,005 35.0% $197,351 35.0% $157,823 35.0%
State income taxes, net of federal
income tax benefit ............. 17,149 2.8 15,885 2.8 11,599 2.6
Valuation allowance ............. 1,566 0.3 (1,286) (0.2) (653) (0.2)
Other ......................... (6,007) (1.0) (6,227) (1.1) (9,110) (2.0)
Actual income tax expense ........ $228,713 37.1% $205,723 36.5% $159,659 35.4%
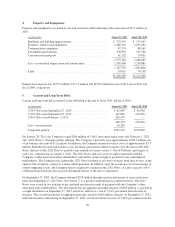
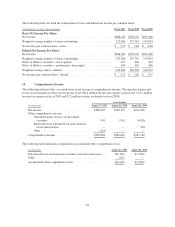
The tax effects of temporary differences that give rise to significant portions of the deferred tax assets and
deferred tax liabilities as of the end of fiscal 2011 and the end of fiscal 2010, were as follows:
(in thousands) August 27, 2011 August 28, 2010
Deferred income tax liabilities:
Excess of book over tax basis of property and equipment ..... $124,243 $73,341
Deferred income tax assets:
Excess of tax over book basis of inventories ................ $ 17,372 $10,403
Nondeductible accruals for:
Insurance ....................................... 19,078 20,057
Compensation ................................... 29,463 32,426
Deferred rent .................................... 14,708 13,913
Litigation charge ................................. 151 508
Other .............................................. 18,241 12,410
Gross deferred income tax assets ............................. 99,013 89,717
Less: valuation allowance .................................. (3,999) (2,433)
Net deferred tax assets ..................................... $ 95,014 $87,284
52