Family Dollar 2011 Annual Report Download - page 42
Download and view the complete annual report
Please find page 42 of the 2011 Family Dollar annual report below. You can navigate through the pages in the report by either clicking on the pages listed below, or by using the keyword search tool below to find specific information within the annual report.-
 1
1 -
2
-
3
-
4
-
5
-
6
-
7
-
8
-
9
-
10
-
11
-
12
-
13
-
14
-
15
-
16
-
17
-
18
-
19
-
20
-
21
-
22
-
23
-
24
-
25
-
26
-
27
-
28
-
29
-
30
-
31
-
 32
32 -
 33
33 -
 34
34 -
 35
35 -
 36
36 -
 37
37 -
 38
38 -
 39
39 -
 40
40 -
 41
41 -
 42
42 -
 43
43 -
 44
44 -
 45
45 -
 46
46 -
 47
47 -
 48
48 -
 49
49 -
 50
50 -
 51
51 -
 52
52 -
53
-
54
-
55
-
56
-
57
-
58
-
59
-
60
-
61
-
62
-
63
-
64
-
65
-
66
-
67
-
68
-
69
-
70
-
71
-
72
-
73
-
74
-
75
-
76
-
77
-
78
-
79
-
80
 |
 |

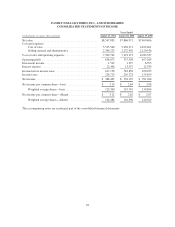
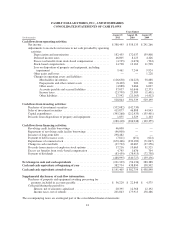
FAMILY DOLLAR STORES, INC., AND SUBSIDIARIES
CONSOLIDATED STATEMENTS OF INCOME
Years Ended
(in thousands, except per share amounts) August 27, 2011 August 28, 2010 August 29, 2009
Net sales ............................................. $8,547,835 $7,866,971 $7,400,606
Cost and expenses:
Cost of sales ...................................... 5,515,540 5,058,971 4,822,401
Selling, general and administrative .................... 2,394,223 2,232,402 2,120,936
Cost of sales and operating expenses ....................... 7,909,763 7,291,373 6,943,337
Operating profit ....................................... 638,072 575,598 457,269
Investment income ..................................... 1,532 1,597 6,595
Interest expense ....................................... 22,446 13,337 12,939
Income before income taxes ............................. 617,158 563,858 450,925
Income taxes ......................................... 228,713 205,723 159,659
Net income ........................................... $ 388,445 $ 358,135 $ 291,266
Net income per common share—basic ..................... $ 3.15 $ 2.64 $ 2.08
Weighted average shares—basic ...................... 123,360 135,745 139,894
Net income per common share—diluted .................... $ 3.12 $ 2.62 $ 2.07
Weighted average shares—diluted .................... 124,486 136,596 140,522
The accompanying notes are an integral part of the consolidated financial statements.
38