Dell 2006 Annual Report Download - page 80
Download and view the complete annual report
Please find page 80 of the 2006 Dell annual report below. You can navigate through the pages in the report by either clicking on the pages listed below, or by using the keyword search tool below to find specific information within the annual report.-
 1
1 -
2
-
3
-
4
-
5
-
6
-
7
-
8
-
9
-
10
-
11
-
12
-
13
-
14
-
15
-
16
-
17
-
18
-
19
-
20
-
21
-
22
-
23
-
24
-
25
-
26
-
27
-
28
-
29
-
30
-
31
-
32
-
33
-
34
-
35
-
36
-
37
-
38
-
39
-
40
-
41
-
42
-
43
-
44
-
45
-
46
-
47
-
48
-
49
-
50
-
51
-
52
-
53
-
54
-
55
-
56
-
57
-
58
-
59
-
60
-
61
-
62
-
63
-
64
-
65
-
66
-
67
-
68
-
69
-
 70
70 -
 71
71 -
 72
72 -
 73
73 -
 74
74 -
 75
75 -
 76
76 -
 77
77 -
 78
78 -
 79
79 -
 80
80 -
 81
81 -
 82
82 -
 83
83 -
 84
84 -
 85
85 -
 86
86 -
 87
87 -
 88
88 -
 89
89 -
 90
90 -
91
-
92
-
93
-
94
-
95
-
96
-
97
-
98
-
99
-
100
-
101
-
102
-
103
-
104
-
105
-
106
-
107
-
108
-
109
-
110
-
111
-
112
-
113
-
114
-
115
-
116
-
117
-
118
-
119
-
120
-
121
-
122
-
123
-
124
-
125
-
126
-
127
-
128
-
129
-
130
-
131
-
132
-
133
-
134
-
135
-
136
-
137
-
138
-
139
-
140
-
141
-
142
-
143
-
144
-
145
-
146
-
147
-
148
-
149
-
150
-
151
-
152
-
153
-
154
-
155
-
156
-
157
-
158
-
159
-
160
-
161
-
162
-
163
-
164
-
165
-
166
-
167
-
168
-
169
-
170
-
171
-
172
-
173
-
174
-
175
-
176
 |
 |

Table of Contents
DELL INC.
NOTES TO CONSOLIDATED FINANCIAL STATEMENTS (continued)
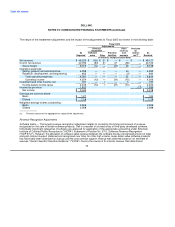
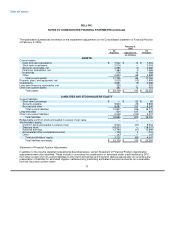
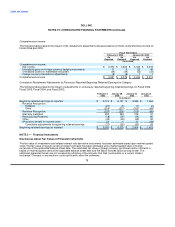
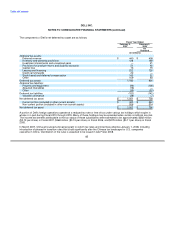
The table below summarizes the effects of the restatement adjustments on the Consolidated Statement of Financial Position
at February 3, 2006.
February 3,
2006
As As
Reported Adjustments Restated
(in millions)
ASSETS
Current assets:
Cash and cash equivalents $ 7,042 $ 12 $ 7,054
Short-term investments 2,016 — 2,016
Accounts receivable, net 4,089 (7) 4,082
Financing receivables, net 1,363 3 1,366
Inventories 576 12 588
Other 2,620 68 2,688
Total current assets 17,706 88 17,794
Property, plant, and equipment, net 2,005 (12) 1,993
Investments 2,691 (5) 2,686
Long-term financing receivables, net 325 — 325
Other non-current assets 382 72 454
Total assets $ 23,109 $ 143 $ 23,252
LIABILITIES AND STOCKHOLDERS' EQUITY
Current liabilities:
Short-term borrowings $ — $ 65 $ 65
Accounts payable 9,840 28 9,868
Accrued and other 6,087 153 6,240
Total current liabilities 15,927 246 16,173
Long-term debt 504 121 625
Other non-current liabilities 2,549 (142) 2,407
Total liabilities 18,980 225 19,205
Redeemable common stock and capital in excess of par value — — —
Stockholders' equity:
Common stock and capital in excess of par 9,540 (37) 9,503
Treasury stock (18,007) — (18,007)
Retained earnings 12,746 (47) 12,699
Accumulated other comprehensive loss (103) 2 (101)
Other (47) — (47)
Total stockholders' equity 4,129 (82) 4,047
Total liabilities and equity $ 23,109 $ 143 $ 23,252
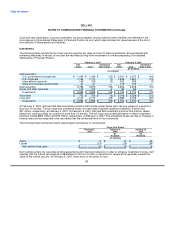
Statement of Financial Position Adjustments
In addition to the income statement adjustments described above, certain Statement of Financial Position classification
adjustments were also identified. These include (i) correcting the classification of advances under credit facilities by DFS
from other current and non-current liabilities to short-term borrowings and long-term debt as appropriate; (ii) correcting the
presentation of liabilities for estimated litigation settlements by presenting estimated insurance recoveries as a receivable
from the insurance carriers rather
77