Dell 2006 Annual Report Download - page 48
Download and view the complete annual report
Please find page 48 of the 2006 Dell annual report below. You can navigate through the pages in the report by either clicking on the pages listed below, or by using the keyword search tool below to find specific information within the annual report.-
 1
1 -
2
-
3
-
4
-
5
-
6
-
7
-
8
-
9
-
10
-
11
-
12
-
13
-
14
-
15
-
16
-
17
-
18
-
19
-
20
-
21
-
22
-
23
-
24
-
25
-
26
-
27
-
28
-
29
-
30
-
31
-
32
-
33
-
34
-
35
-
36
-
37
-
 38
38 -
 39
39 -
 40
40 -
 41
41 -
 42
42 -
 43
43 -
 44
44 -
 45
45 -
 46
46 -
 47
47 -
 48
48 -
 49
49 -
 50
50 -
 51
51 -
 52
52 -
 53
53 -
 54
54 -
 55
55 -
 56
56 -
 57
57 -
 58
58 -
59
-
60
-
61
-
62
-
63
-
64
-
65
-
66
-
67
-
68
-
69
-
70
-
71
-
72
-
73
-
74
-
75
-
76
-
77
-
78
-
79
-
80
-
81
-
82
-
83
-
84
-
85
-
86
-
87
-
88
-
89
-
90
-
91
-
92
-
93
-
94
-
95
-
96
-
97
-
98
-
99
-
100
-
101
-
102
-
103
-
104
-
105
-
106
-
107
-
108
-
109
-
110
-
111
-
112
-
113
-
114
-
115
-
116
-
117
-
118
-
119
-
120
-
121
-
122
-
123
-
124
-
125
-
126
-
127
-
128
-
129
-
130
-
131
-
132
-
133
-
134
-
135
-
136
-
137
-
138
-
139
-
140
-
141
-
142
-
143
-
144
-
145
-
146
-
147
-
148
-
149
-
150
-
151
-
152
-
153
-
154
-
155
-
156
-
157
-
158
-
159
-
160
-
161
-
162
-
163
-
164
-
165
-
166
-
167
-
168
-
169
-
170
-
171
-
172
-
173
-
174
-
175
-
176
 |
 |
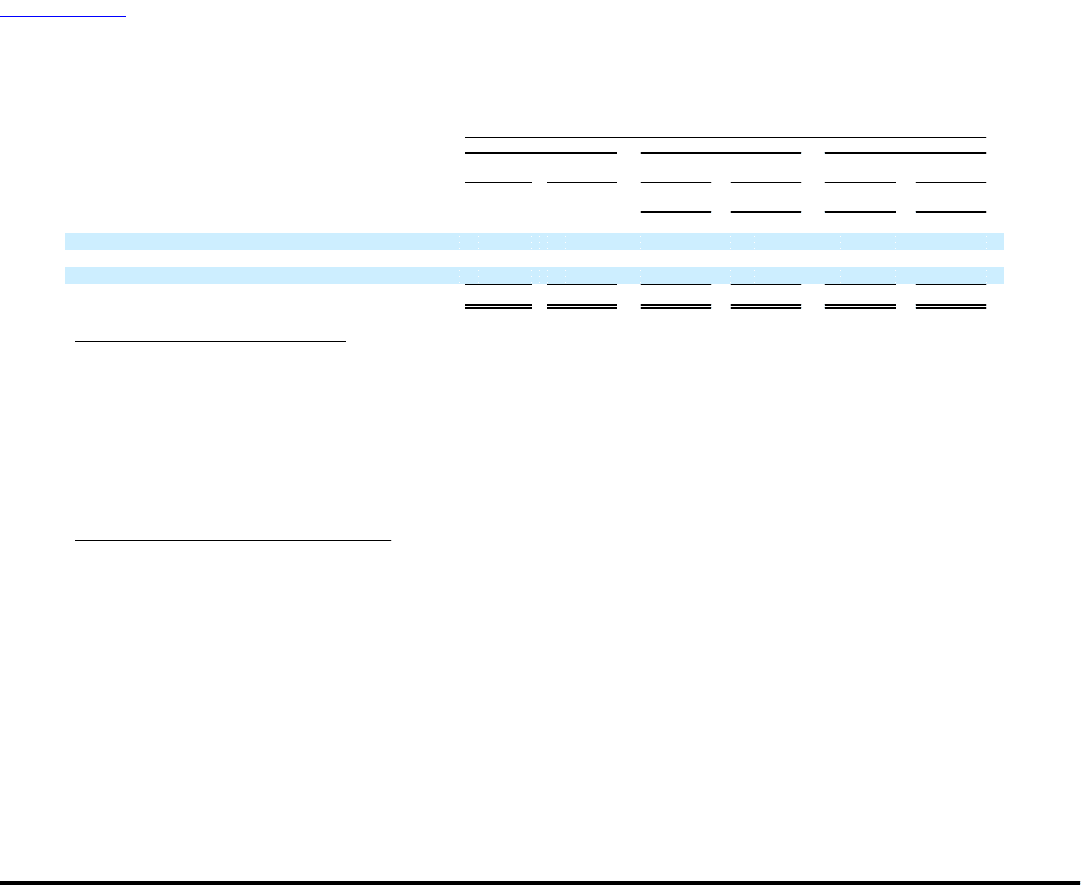
Table of Contents
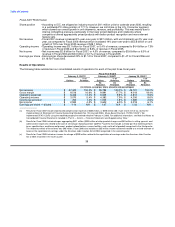
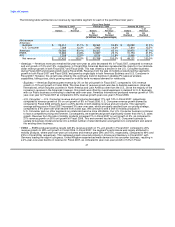
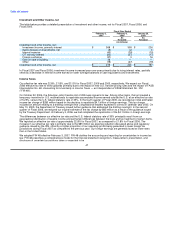
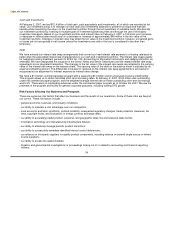
Operating Expenses
The following table presents information regarding our operating expenses during each of the past three fiscal years:
Fiscal Year Ended
February 2, 2007 February 3, 2006 January 28, 2005
% of % of % of
Dollars Revenue Dollars Revenue Dollars Revenue
As As As As
Restated Restated Restated Restated
(in millions, except percentages)
Operating expenses:
Selling, general, and administrative $ 5,948 10.3% $ 5,051 9.0% $ 4,352 8.9%
Research, development, and engineering 498 0.9% 458 0.8% 460 0.9%
Operating expenses $ 6,446 11.2% $ 5,509 9.8% $ 4,812 9.8%
• Selling, General, and Administrative — During Fiscal 2007, selling, general, and administrative expenses increased 18% to
$5.9 billion, compared to $5.1 billion for Fiscal 2006. The increase in Fiscal 2007 as compared to Fiscal 2006 was primarily
attributed to increased compensation costs and outside consulting services. This increase was largely due to increased
stock-based compensation expense due to the adoption of SFAS 123(R) ($272 million), and costs related to the Audit
Committee investigation and related restatement ($100 million). In addition, during Fiscal 2007, we made incremental
customer experience investments of $150 million to improve customer satisfaction, repurchase preferences, as well as
technical support. As a result, we increased our headcount through direct hiring and replacing of temporary staff with
regular employees. During Fiscal 2006, selling, general, and administrative expenses as a percentage of revenue increased
compared to Fiscal 2005. The increase over Fiscal 2005 primarily related to increased advertising costs, headcount growth,
as well as charges of $83 million related to workforce realignment costs ($50 million), costs of operating leases on office
space no longer utilized ($4 million) and a write-off of goodwill ($29 million).
• Research, Development, and Engineering — During Fiscal 2007, research, development, and engineering expenses
increased slightly in absolute dollars, but remained consistent with Fiscal 2006 and 2005 as percentage of net revenue. We
continue to fund research, development, and engineering activities to meet the demand for swift product cycles. As a result,
Fiscal 2007 research, development, and engineering expenses increased in absolute dollars due to increased staffing
levels, product development costs, and stock-based compensation expense resulting from the adoption of SFAS 123(R).
Fiscal 2006 as compared to Fiscal 2005 experienced a slight decrease in the percentage of net revenue primarily attributed
to our revenue growth. We manage our research, development, and engineering spending by targeting those innovations
and products most valuable to our customers, and by relying upon the capabilities of our strategic partners. We will
continue to invest in research, development, and engineering activities to support our growth and to provide for new,
competitive products. We obtained 1,759 worldwide patents and have applied for 1,824 additional worldwide patents at
February 2, 2007.
On May 31, 2007, we announced that we had initiated a comprehensive review of costs across all processes and
organizations with the goal to simplify structure, eliminate redundancies, and better align operating expenses with the current
business environment and strategic growth opportunities. As part of this overall effort, we expect to reduce headcount and
infrastructure costs over the next 12 months. Our management teams are presently finalizing transformation plans which
include headcount and infrastructure cost reduction goals. This headcount reduction is expected to impact both cost of goods
sold and operating expenses worldwide.
45