Dell 2006 Annual Report Download - page 43
Download and view the complete annual report
Please find page 43 of the 2006 Dell annual report below. You can navigate through the pages in the report by either clicking on the pages listed below, or by using the keyword search tool below to find specific information within the annual report.-
 1
1 -
2
-
3
-
4
-
5
-
6
-
7
-
8
-
9
-
10
-
11
-
12
-
13
-
14
-
15
-
16
-
17
-
18
-
19
-
20
-
21
-
22
-
23
-
24
-
25
-
26
-
27
-
28
-
29
-
30
-
31
-
32
-
 33
33 -
 34
34 -
 35
35 -
 36
36 -
 37
37 -
 38
38 -
 39
39 -
 40
40 -
 41
41 -
 42
42 -
 43
43 -
 44
44 -
 45
45 -
 46
46 -
 47
47 -
 48
48 -
 49
49 -
 50
50 -
 51
51 -
 52
52 -
 53
53 -
54
-
55
-
56
-
57
-
58
-
59
-
60
-
61
-
62
-
63
-
64
-
65
-
66
-
67
-
68
-
69
-
70
-
71
-
72
-
73
-
74
-
75
-
76
-
77
-
78
-
79
-
80
-
81
-
82
-
83
-
84
-
85
-
86
-
87
-
88
-
89
-
90
-
91
-
92
-
93
-
94
-
95
-
96
-
97
-
98
-
99
-
100
-
101
-
102
-
103
-
104
-
105
-
106
-
107
-
108
-
109
-
110
-
111
-
112
-
113
-
114
-
115
-
116
-
117
-
118
-
119
-
120
-
121
-
122
-
123
-
124
-
125
-
126
-
127
-
128
-
129
-
130
-
131
-
132
-
133
-
134
-
135
-
136
-
137
-
138
-
139
-
140
-
141
-
142
-
143
-
144
-
145
-
146
-
147
-
148
-
149
-
150
-
151
-
152
-
153
-
154
-
155
-
156
-
157
-
158
-
159
-
160
-
161
-
162
-
163
-
164
-
165
-
166
-
167
-
168
-
169
-
170
-
171
-
172
-
173
-
174
-
175
-
176
 |
 |

Table of Contents
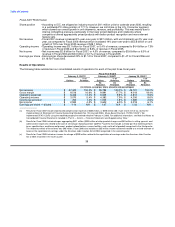
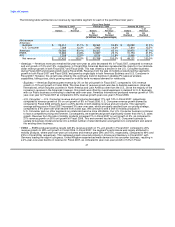
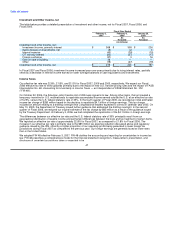
Consolidated Operations
Fiscal 2007 revenue increased 3% year-over-year to $57.4 billion, with unit shipments up 2% year-over-year. Revenue grew
across the EMEA and APJ regions by 6% and 12%, respectively, while the Americas region revenue remained flat year-over-
year. Revenue outside the U.S. represented approximately 44% of Fiscal 2007 consolidated revenue, compared to
approximately 41% in the prior year. Outside the U.S., we produced 10% year-over-year revenue growth for Fiscal 2007.
During Fiscal 2007, Americas Business revenue grew by 3% and U.S. Consumer revenue declined by 11%. All product
categories grew revenue over the prior year periods, other than desktop PCs. Desktop PC revenue in the Americas and
EMEA regions declined 12% and 6% year-over-year, respectively. This decline in desktop PC revenue reflects an industry-
wide shift to mobility products. During Fiscal 2006, revenue increased 14% year-over-year to $55.8 billion, with unit
shipments up 19% year-over-year. This included an extra week of operations that contributed almost one percentage point of
added revenue growth. Revenue outside the U.S. represented 41% of Fiscal 2006 consolidated revenue compared to 38% in
the prior year. Outside the U.S., we produced 21% year-over-year revenue growth for Fiscal 2006.
Operating and net income for Fiscal 2007, Fiscal 2006, and Fiscal 2005 were $3.1 billion and $2.6 billion, $4.4 billion and
$3.6 billion, $4.2 billion and $3.0 billion, respectively. Net income for Fiscal 2006 and Fiscal 2005 includes an income tax
repatriation benefit of $85 million and a charge of $280 million, respectively, pursuant to a favorable tax incentive provided by
the American Jobs Creation Act of 2004. This tax benefit and charge is related to the Fiscal 2006 repatriation of $4.1 billion
in foreign earnings.
Our average selling price in Fiscal 2007 increased 1% year-over-year, which primarily resulted from our pricing strategy,
compared to a 4% year-over-year decrease for Fiscal 2006. In Fiscal 2007 we continued to see intensive competitive
pressure, particularly for lower priced desktops and notebooks, as competitors offered aggressively priced products with
better product recognition and more relevant feature sets. As a result, particularly in the U.S., we lost share in the consumer
segment in notebooks and desktops, which slowed our overall growth in unit shipments, revenue, and profitability. We
currently expect that our pricing environment will likely continue for the foreseeable future.
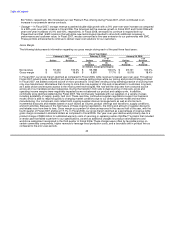
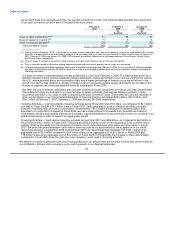
Revenues by Segment
We conduct operations worldwide and manage our business in three geographic regions: the Americas, EMEA, and APJ.
The Americas region covers the U.S., Canada, and Latin America. Within the Americas, we are further segmented into
Business and U.S. Consumer. The Business segment includes sales to corporate, government, healthcare, education, and
small and medium business customers within the Americas region, while the U.S. Consumer segment primarily includes
sales to individual consumers within the U.S. The EMEA region covers Europe, the Middle East, and Africa. The APJ region
covers the Asian countries of the Pacific Rim as well as Australia, New Zealand, and India.
40