Dell 2006 Annual Report Download - page 66
Download and view the complete annual report
Please find page 66 of the 2006 Dell annual report below. You can navigate through the pages in the report by either clicking on the pages listed below, or by using the keyword search tool below to find specific information within the annual report.
Table of Contents
DELL INC.
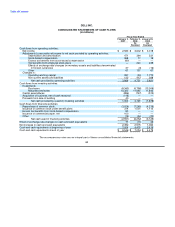
CONSOLIDATED STATEMENTS OF CASH FLOWS
(in millions)
Fiscal Year Ended
February 2, February 3, January 28,
2007 2006 2005
As As
Restated Restated
Cash flows from operating activities:
Net income $ 2,583 $ 3,602 $ 3,018
Adjustments to reconcile net income to net cash provided by operating activities:
Depreciation and amortization 471 394 331
Stock-based compensation 368 17 18
Excess tax benefits from stock-based compensation (80) — —
Tax benefits from employee stock plans — 224 249
Effects of exchange rate changes on monetary assets and liabilities denominated
in foreign currencies 37 (3) (16)
Other 61 157 61
Changes in:
Operating working capital 397 (53) 1,772
Non-current assets and liabilities 132 413 388
Net cash provided by operating activities 3,969 4,751 5,821
Cash flows from investing activities:
Investments:
Purchases (8,343) (6,796) (13,006)
Maturities and sales 10,320 11,692 11,843
Capital expenditures (896) (747) (515)
Acquisition of business, net of cash received (118) — —
Proceeds from sale of building 40 — —
Net cash provided by (used in) investing activities 1,003 4,149 (1,678)
Cash flows from financing activities:
Repurchase of common stock (3,026) (7,249) (4,219)
Issuance of common stock under benefit plans 314 1,051 1,112
Excess tax benefits from stock-based compensation 80 — —
Issuance of commercial paper, net 100 — —
Other (19) (54) (22)
Net cash used in financing activities (2,551) (6,252) (3,129)
Effect of exchange rate changes on cash and cash equivalents 71 (73) 46
Net increase in cash and cash equivalents 2,492 2,575 1,060
Cash and cash equivalents at beginning of year 7,054 4,479 3,419
Cash and cash equivalents at end of year $ 9,546 $ 7,054 $ 4,479
The accompanying notes are an integral part of these consolidated financial statements.
63


