Dell 2006 Annual Report Download - page 37
Download and view the complete annual report
Please find page 37 of the 2006 Dell annual report below. You can navigate through the pages in the report by either clicking on the pages listed below, or by using the keyword search tool below to find specific information within the annual report.-
 1
1 -
2
-
3
-
4
-
5
-
6
-
7
-
8
-
9
-
10
-
11
-
12
-
13
-
14
-
15
-
16
-
17
-
18
-
19
-
20
-
21
-
22
-
23
-
24
-
25
-
26
-
 27
27 -
 28
28 -
 29
29 -
 30
30 -
 31
31 -
 32
32 -
 33
33 -
 34
34 -
 35
35 -
 36
36 -
 37
37 -
 38
38 -
 39
39 -
 40
40 -
 41
41 -
 42
42 -
 43
43 -
 44
44 -
 45
45 -
 46
46 -
 47
47 -
48
-
49
-
50
-
51
-
52
-
53
-
54
-
55
-
56
-
57
-
58
-
59
-
60
-
61
-
62
-
63
-
64
-
65
-
66
-
67
-
68
-
69
-
70
-
71
-
72
-
73
-
74
-
75
-
76
-
77
-
78
-
79
-
80
-
81
-
82
-
83
-
84
-
85
-
86
-
87
-
88
-
89
-
90
-
91
-
92
-
93
-
94
-
95
-
96
-
97
-
98
-
99
-
100
-
101
-
102
-
103
-
104
-
105
-
106
-
107
-
108
-
109
-
110
-
111
-
112
-
113
-
114
-
115
-
116
-
117
-
118
-
119
-
120
-
121
-
122
-
123
-
124
-
125
-
126
-
127
-
128
-
129
-
130
-
131
-
132
-
133
-
134
-
135
-
136
-
137
-
138
-
139
-
140
-
141
-
142
-
143
-
144
-
145
-
146
-
147
-
148
-
149
-
150
-
151
-
152
-
153
-
154
-
155
-
156
-
157
-
158
-
159
-
160
-
161
-
162
-
163
-
164
-
165
-
166
-
167
-
168
-
169
-
170
-
171
-
172
-
173
-
174
-
175
-
176
 |
 |
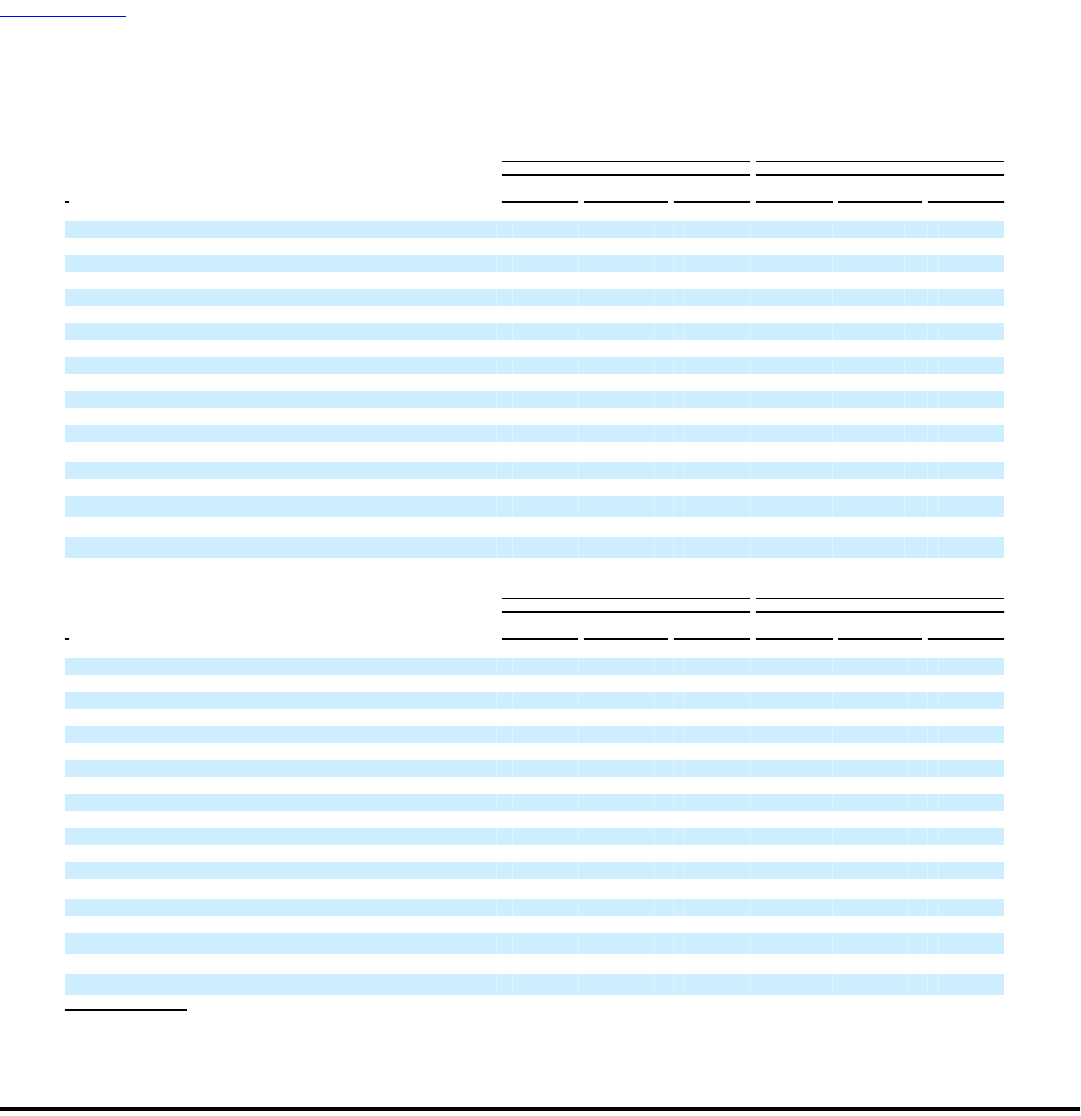
Table of Contents
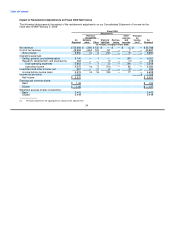
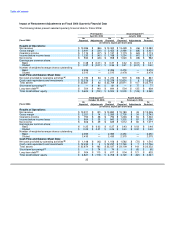
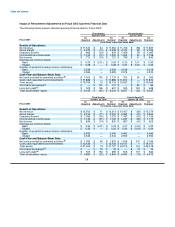
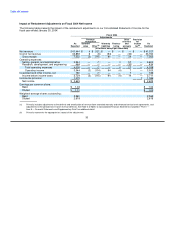
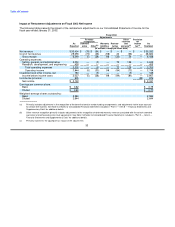
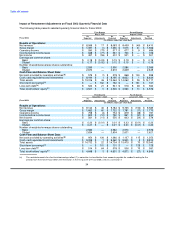
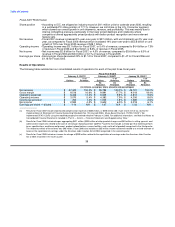
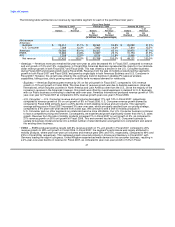
Impact of Restatement Adjustments on Fiscal 2003 Quarterly Financial Data
The following table presents selected quarterly financial data for Fiscal 2003:
First Quarter Second Quarter
May 3, 2002 August 2, 2002
As As As As
Fiscal 2003 Reported Adjustments Restated Reported Adjustments Restated
(in millions, expect per share data)
Results of Operations:
Net revenue $ 8,066 $ 17 $ 8,083 $ 8,459 $ (49) $ 8,410
Gross margin $ 1,391 $ (1) $ 1,390 $ 1,515 $ 41 $ 1,556
Operating income $ 590 $ (73) $ 517 $ 677 $ 9 $ 686
Income before income taxes $ 638 $ (77) $ 561 $ 726 $ — $ 726
Net income $ 457 $ (56) $ 401 $ 501 $ — $ 501
Earnings per common share:
Basic $ 0.18 $ (0.03) $ 0.15 $ 0.19 $ — $ 0.19
Diluted $ 0.17 $ (0.02) $ 0.15 $ 0.19 $ — $ 0.19
Number of weighted-average shares outstanding:
Basic 2,595 — 2,595 2,586 — 2,586
Diluted 2,672 — 2,672 2,649 — 2,649
Cash Flow and Balance Sheet Data:
Net cash provided by operating activities(d) $ 579 $ (1) $ 578 $ 868 $ 130 $ 998
Cash, cash equivalents and investments $ 8,194 $ 1 $ 8,195 $ 8,633 $ 1 $ 8,634
Total assets $ 13,316 $ 46 $ 13,362 $ 14,062 $ 55 $ 14,117
Short-term borrowings(a) $ — $ 162 $ 162 $ — $ 161 $ 161
Long-term debt(b) $ 520 $ 21 $ 541 $ 516 $ 48 $ 564
Total stockholders' equity(c) $ 4,521 $ 5 $ 4,526 $ 4,566 $ 10 $ 4,576
Third Quarter Fourth Quarter
November 1, 2002 January 31, 2003
As As As As
Fiscal 2003 Reported Adjustments Restated Reported Adjustments Restated
(in millions, expect per share data)
Results of Operations:
Net revenue $ 9,144 $ 40 $ 9,184 $ 9,735 $ (150) $ 9,585
Gross margin $ 1,662 $ 60 $ 1,722 $ 1,781 $ (11) $ 1,770
Operating income $ 758 $ (4) $ 754 $ 819 $ (38) $ 781
Income before income taxes $ 802 $ (12) $ 790 $ 861 $ (31) $ 830
Net income $ 561 $ (11) $ 550 $ 603 $ (24) $ 579
Earnings per common share:
Basic $ 0.22 $ (0.01) $ 0.21 $ 0.23 $ (0.01) $ 0.22
Diluted $ 0.21 $ — $ 0.21 $ 0.23 $ (0.01) $ 0.22
Number of weighted-average shares outstanding:
Basic 2,582 — 2,582 2,576 — 2,576
Diluted 2,634 — 2,634 2,621 — 2,621
Cash Flow and Balance Sheet Data:
Net cash provided by operating activities(d) $ 954 $ 126 $ 1,080 $ 1,137 $ 115 $ 1,252
Cash, cash equivalents and investments $ 9,059 $ 1 $ 9,060 $ 9,905 $ 5 $ 9,910
Total assets $ 14,712 $ 22 $ 14,734 $ 15,470 $ 70 $ 15,540
Short-term borrowings(a) $ — $ 101 $ 101 $ — $ 129 $ 129
Long-term debt(b) $ 514 $ 64 $ 578 $ 506 $ 75 $ 581
Total stockholders' equity(c) $ 4,648 $ 3 $ 4,651 $ 4,873 $ (27) $ 4,846
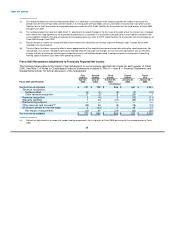
(a) The restated amounts for short-term borrowings reflect (1) a correction in classification from accounts payable for vendor financing for the
periods from the end of Fiscal 2002 until termination in the first quarter of Fiscal 2006, and (2) a correction in
34