Dell 2006 Annual Report Download - page 30
Download and view the complete annual report
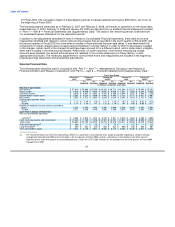
Please find page 30 of the 2006 Dell annual report below. You can navigate through the pages in the report by either clicking on the pages listed below, or by using the keyword search tool below to find specific information within the annual report.-
 1
1 -
2
-
3
-
4
-
5
-
6
-
7
-
8
-
9
-
10
-
11
-
12
-
13
-
14
-
15
-
16
-
17
-
18
-
19
-
 20
20 -
 21
21 -
 22
22 -
 23
23 -
 24
24 -
 25
25 -
 26
26 -
 27
27 -
 28
28 -
 29
29 -
 30
30 -
 31
31 -
 32
32 -
 33
33 -
 34
34 -
 35
35 -
 36
36 -
 37
37 -
 38
38 -
 39
39 -
 40
40 -
41
-
42
-
43
-
44
-
45
-
46
-
47
-
48
-
49
-
50
-
51
-
52
-
53
-
54
-
55
-
56
-
57
-
58
-
59
-
60
-
61
-
62
-
63
-
64
-
65
-
66
-
67
-
68
-
69
-
70
-
71
-
72
-
73
-
74
-
75
-
76
-
77
-
78
-
79
-
80
-
81
-
82
-
83
-
84
-
85
-
86
-
87
-
88
-
89
-
90
-
91
-
92
-
93
-
94
-
95
-
96
-
97
-
98
-
99
-
100
-
101
-
102
-
103
-
104
-
105
-
106
-
107
-
108
-
109
-
110
-
111
-
112
-
113
-
114
-
115
-
116
-
117
-
118
-
119
-
120
-
121
-
122
-
123
-
124
-
125
-
126
-
127
-
128
-
129
-
130
-
131
-
132
-
133
-
134
-
135
-
136
-
137
-
138
-
139
-
140
-
141
-
142
-
143
-
144
-
145
-
146
-
147
-
148
-
149
-
150
-
151
-
152
-
153
-
154
-
155
-
156
-
157
-
158
-
159
-
160
-
161
-
162
-
163
-
164
-
165
-
166
-
167
-
168
-
169
-
170
-
171
-
172
-
173
-
174
-
175
-
176
 |
 |
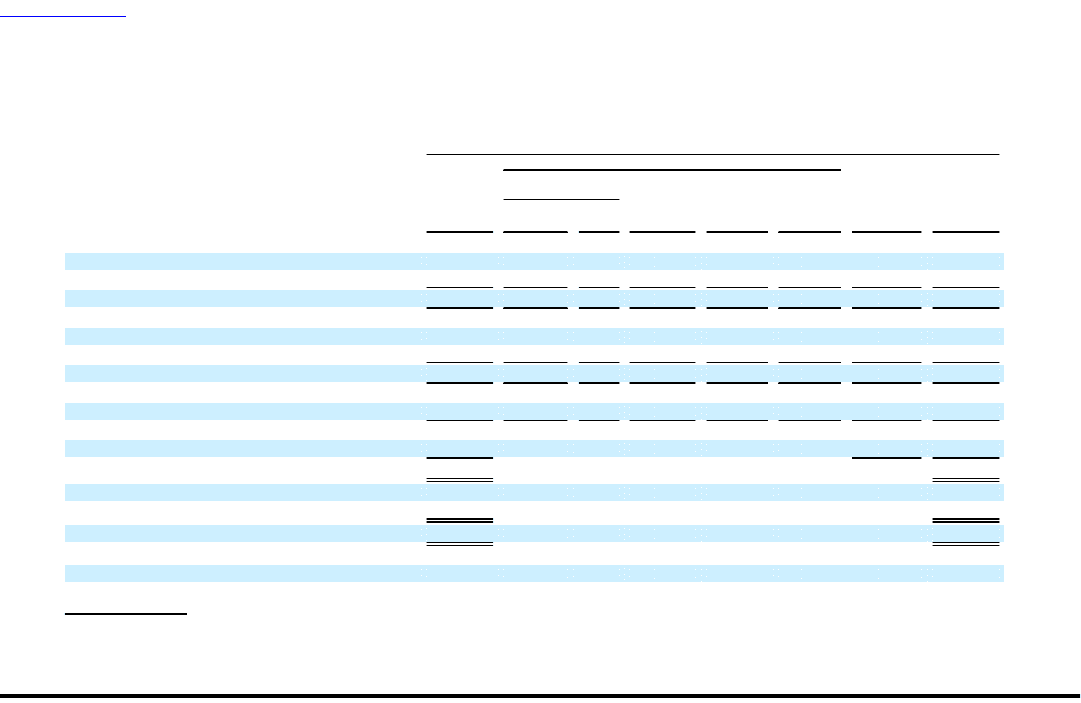
Table of Contents
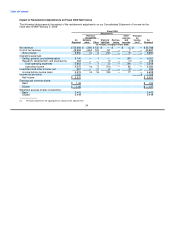
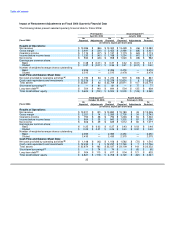
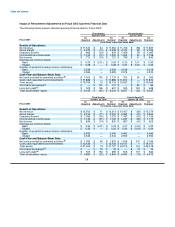
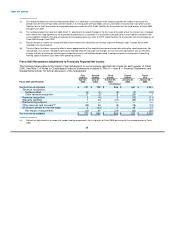
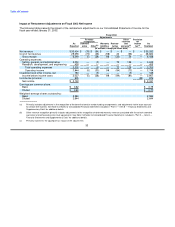
Impact of Restatement Adjustments on Fiscal 2005 Net Income
The following table presents the impact of the restatement adjustments on our Consolidated Statement of Income for the
fiscal year ended January 28, 2005:
Fiscal 2005
Adjustments
Revenue Other Provision
recognition reserves for
As Software Warranty Restruc- and income As
Reported sales Other liabilities turing accruals tax(a) Restated
(in millions, except per share data)
Net revenue $ 49,205 $ (105) $ 21 $ — $ — $ — $ — $ 49,121
Cost of net revenue 40,190 (93) 21 21 — (36) — 40,103
Gross margin 9,015 (12) — (21) — 36 — 9,018
Operating expenses:
Selling, general, and administrative 4,298 — — — — 54 — 4,352
Research, development, and engineering 463 — — — — (3) — 460
Total operating expenses 4,761 — — — — 51 — 4,812
Operating income 4,254 (12) — (21) — (15) — 4,206
Investment and other income, net 191 — 1 — — 5 — 197
Income before income taxes 4,445 (12) 1 (21) — (10) — 4,403
Income tax provision 1,402 (17) 1,385
Net income $ 3,043 $ 3,018
Earnings per common share:
Basic $ 1.21 $ 1.20
Diluted $ 1.18 $ 1.18
Weighted-average shares outstanding:
Basic 2,509 2,509
Diluted 2,568 2,568
(a) Primarily represents the aggregate tax impact of the adjustments.
27