Dell 2006 Annual Report Download - page 45
Download and view the complete annual report
Please find page 45 of the 2006 Dell annual report below. You can navigate through the pages in the report by either clicking on the pages listed below, or by using the keyword search tool below to find specific information within the annual report.-
 1
1 -
2
-
3
-
4
-
5
-
6
-
7
-
8
-
9
-
10
-
11
-
12
-
13
-
14
-
15
-
16
-
17
-
18
-
19
-
20
-
21
-
22
-
23
-
24
-
25
-
26
-
27
-
28
-
29
-
30
-
31
-
32
-
33
-
34
-
 35
35 -
 36
36 -
 37
37 -
 38
38 -
 39
39 -
 40
40 -
 41
41 -
 42
42 -
 43
43 -
 44
44 -
 45
45 -
 46
46 -
 47
47 -
 48
48 -
 49
49 -
 50
50 -
 51
51 -
 52
52 -
 53
53 -
 54
54 -
 55
55 -
56
-
57
-
58
-
59
-
60
-
61
-
62
-
63
-
64
-
65
-
66
-
67
-
68
-
69
-
70
-
71
-
72
-
73
-
74
-
75
-
76
-
77
-
78
-
79
-
80
-
81
-
82
-
83
-
84
-
85
-
86
-
87
-
88
-
89
-
90
-
91
-
92
-
93
-
94
-
95
-
96
-
97
-
98
-
99
-
100
-
101
-
102
-
103
-
104
-
105
-
106
-
107
-
108
-
109
-
110
-
111
-
112
-
113
-
114
-
115
-
116
-
117
-
118
-
119
-
120
-
121
-
122
-
123
-
124
-
125
-
126
-
127
-
128
-
129
-
130
-
131
-
132
-
133
-
134
-
135
-
136
-
137
-
138
-
139
-
140
-
141
-
142
-
143
-
144
-
145
-
146
-
147
-
148
-
149
-
150
-
151
-
152
-
153
-
154
-
155
-
156
-
157
-
158
-
159
-
160
-
161
-
162
-
163
-
164
-
165
-
166
-
167
-
168
-
169
-
170
-
171
-
172
-
173
-
174
-
175
-
176
 |
 |

Table of Contents
2006. With the exception of desktop PCs, all product categories in this region experienced growth for Fiscal 2007 with
mobility, storage, and enhanced services revenues posting strong gains. This continues the general trend from Fiscal 2006
where EMEA's revenue growth was strongest in mobility, enhanced services, and software and peripherals.
• Asia Pacific-Japan — APJ continued to build a substantial presence, with 12% revenue growth on 20% unit growth in Fiscal
2007 and 20% revenue growth on 30% unit growth in Fiscal 2006. The region was led by 26% year-over-year revenue
growth in China during Fiscal 2007 and a 13% revenue growth in Japan during Fiscal 2006. Fiscal 2007's improved
performance was partially offset by Japan's results, which saw revenue decline 5% year-over-year. In Fiscal 2007, India,
South Korea, Singapore, and Malaysia produced significant year-over-year revenue growth at a higher rate than the overall
region. All product categories in this region experienced revenue growth during Fiscal 2007 and Fiscal 2006. Mobility
revenue grew 12% on unit growth of 31% during Fiscal 2007 compared to 24% revenue growth on 48% unit growth during
Fiscal 2006. Also driving this growth were increases in enhanced services, software and peripherals, and storage, which
approximates the growth trends from Fiscal 2006.
For additional information regarding our reportable segments, see Note 10 of Notes to Consolidated Financial Statements
included in "Part II — Item 8 — Financial Statements and Supplementary Data."
Revenue by Product and Service Categories
We design, develop, manufacture, market, sell, and support a wide range of products that in many cases are customized to
individual customer requirements. Our product categories include desktop computer systems, mobility products, software
and peripherals, servers and networking products, and storage products. In addition, we offer a range of enhanced services.
In the fourth quarter of Fiscal 2007, we performed an analysis of our enhanced services revenue and determined that certain
items previously classified as enhanced services revenue were more appropriately categorized within product revenue.
Fiscal 2007 balances reflect the revised revenue classifications, and prior periods have been revised to conform to the
current period classification. The change in classification of prior period amounts resulted in an increase of $395 million and
$340 million to desktop PCs, $225 million and $171 million to mobility, $10 million and $16 million to software and
peripherals, $16 million and $16 million to servers and networking, and $6 million and $4 million to storage in Fiscal 2006
and 2005, respectively. This change in classification was offset by a decrease in enhanced services of $652 million and
$547 million in Fiscal 2006 and 2005, respectively.
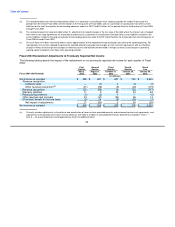
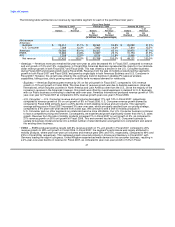
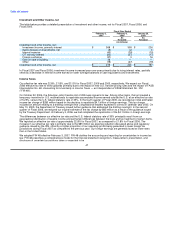
The following table summarizes our net revenue by product category:
Fiscal Year Ended
February 2, 2007 February 3, 2006 January 28, 2005
% of % of % of
Dollars Revenue Dollars Revenue Dollars Revenue
As As As As
Restated Restated Restated Restated
(in millions, except percentage)
Net revenue:
Desktop PCs $ 19,815 34% $ 21,568 39% $ 21,141 43%
Mobility 15,480 27% 14,372 25% 12,001 25%
Software and peripherals 9,001 16% 8,329 15% 6,626 13%
Servers and networking 5,805 10% 5,449 10% 4,880 10%
Enhanced services 5,063 9% 4,207 8% 3,121 6%
Storage 2,256 4% 1,863 3% 1,352 3%
Net revenue $ 57,420 100% $ 55,788 100% $ 49,121 100%
• Desktop PCs — In Fiscal 2007, revenue from desktop PCs (which includes desktop computer systems and workstations)
decreased 8% year-over-year on unit decline of 5%, compared to a 2% revenue increase on unit growth of 10% year-over-
year in Fiscal 2006. Desktop PCs in the Americas declined
42