Dell 2006 Annual Report Download - page 57
Download and view the complete annual report
Please find page 57 of the 2006 Dell annual report below. You can navigate through the pages in the report by either clicking on the pages listed below, or by using the keyword search tool below to find specific information within the annual report.-
 1
1 -
2
-
3
-
4
-
5
-
6
-
7
-
8
-
9
-
10
-
11
-
12
-
13
-
14
-
15
-
16
-
17
-
18
-
19
-
20
-
21
-
22
-
23
-
24
-
25
-
26
-
27
-
28
-
29
-
30
-
31
-
32
-
33
-
34
-
35
-
36
-
37
-
38
-
39
-
40
-
41
-
42
-
43
-
44
-
45
-
46
-
 47
47 -
 48
48 -
 49
49 -
 50
50 -
 51
51 -
 52
52 -
 53
53 -
 54
54 -
 55
55 -
 56
56 -
 57
57 -
 58
58 -
 59
59 -
 60
60 -
 61
61 -
 62
62 -
 63
63 -
 64
64 -
 65
65 -
 66
66 -
 67
67 -
68
-
69
-
70
-
71
-
72
-
73
-
74
-
75
-
76
-
77
-
78
-
79
-
80
-
81
-
82
-
83
-
84
-
85
-
86
-
87
-
88
-
89
-
90
-
91
-
92
-
93
-
94
-
95
-
96
-
97
-
98
-
99
-
100
-
101
-
102
-
103
-
104
-
105
-
106
-
107
-
108
-
109
-
110
-
111
-
112
-
113
-
114
-
115
-
116
-
117
-
118
-
119
-
120
-
121
-
122
-
123
-
124
-
125
-
126
-
127
-
128
-
129
-
130
-
131
-
132
-
133
-
134
-
135
-
136
-
137
-
138
-
139
-
140
-
141
-
142
-
143
-
144
-
145
-
146
-
147
-
148
-
149
-
150
-
151
-
152
-
153
-
154
-
155
-
156
-
157
-
158
-
159
-
160
-
161
-
162
-
163
-
164
-
165
-
166
-
167
-
168
-
169
-
170
-
171
-
172
-
173
-
174
-
175
-
176
 |
 |

Table of Contents
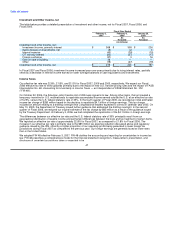
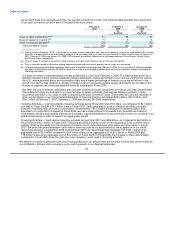
Cash and Investments
At February 2, 2007, we had $12.4 billion of total cash, cash equivalents and investments, all of which are recorded at fair
value. Our investment policy is to manage our total cash and investments balances to preserve principal and maintain
liquidity while maximizing the return on the investment portfolio through the full investment of available funds. We diversify
our investment portfolio by investing in multiple types of investment-grade securities and through the use of third-party
investment managers. Based on our investment portfolio and interest rates at February 2, 2007, a 100 basis point increase
or decrease in interest rates would result in a decrease or increase of approximately $46 million in the fair value of the
investment portfolio. Changes in interest rates may affect the fair value of the investment portfolio; however, unrealized gains
or losses are not recognized in net income unless the investments are sold or the loss is considered to be other than
temporary.
Debt
We have entered into interest rate swap arrangements that convert our fixed interest rate expense to a floating rate basis to
better align the associated interest rate characteristics to our cash and investments portfolio. The interest rate swaps qualify
for hedge accounting treatment pursuant to SFAS No. 133, Accounting for Derivative Instruments and Hedging Activities, as
amended. We have designated the issuance of the Senior Notes and Senior Debentures and the related interest rate swap
agreements as an integrated transaction. The changes in the fair value of the interest rate swaps are reflected in the carrying
value of the interest rate swap on the balance sheet. The carrying value of the debt on the balance sheet is adjusted by an
equal and offsetting amount. The differential to be paid or received on the interest rate swap agreements is accrued and
recognized as an adjustment to interest expense as interest rates change.
We have a $1.0 billion commercial paper program with a supporting $1.0 billion senior unsecured revolving credit facility.
This program allows us to obtain favorable short-term borrowing rates. At February 2, 2007, $100 million was outstanding
under the commercial paper program, and the weighted-average interest rate on these outstanding short-term borrowings
was 5.3%. There were no outstanding advances under the commercial paper program as of October 26, 2007. We use the
proceeds of the program and facility for general corporate purposes, including funding DFS growth.
Risk Factors Affecting Our Business and Prospects
There are numerous risk factors that affect our business and the results of our operations. Some of these risks are beyond
our control. These risk factors include:
• general economic, business, and industry conditions;
• our ability to maintain a cost advantage over our competitors,
• local economic and labor conditions, political instability, unexpected regulatory changes, trade protection measures, tax
laws, copyright levies, and fluctuations in foreign currency exchange rates;
• our ability to accurately predict product, customer, and geographic sales mix and seasonal sales trends;
• information technology and manufacturing infrastructure failures;
• our ability to effectively manage periodic product transitions;
• our ability to successfully remediate identified internal control deficiencies;
• our reliance on third-party suppliers for quality product components, including reliance on several single-source or limited-
source suppliers;
• our ability to access the capital markets;
• litigation and governmental investigations or proceedings arising out of or related to accounting and financial reporting
matters;
54