Dell 2006 Annual Report Download - page 67
Download and view the complete annual report
Please find page 67 of the 2006 Dell annual report below. You can navigate through the pages in the report by either clicking on the pages listed below, or by using the keyword search tool below to find specific information within the annual report.-
 1
1 -
2
-
3
-
4
-
5
-
6
-
7
-
8
-
9
-
10
-
11
-
12
-
13
-
14
-
15
-
16
-
17
-
18
-
19
-
20
-
21
-
22
-
23
-
24
-
25
-
26
-
27
-
28
-
29
-
30
-
31
-
32
-
33
-
34
-
35
-
36
-
37
-
38
-
39
-
40
-
41
-
42
-
43
-
44
-
45
-
46
-
47
-
48
-
49
-
50
-
51
-
52
-
53
-
54
-
55
-
56
-
 57
57 -
 58
58 -
 59
59 -
 60
60 -
 61
61 -
 62
62 -
 63
63 -
 64
64 -
 65
65 -
 66
66 -
 67
67 -
 68
68 -
 69
69 -
 70
70 -
 71
71 -
 72
72 -
 73
73 -
 74
74 -
 75
75 -
 76
76 -
 77
77 -
78
-
79
-
80
-
81
-
82
-
83
-
84
-
85
-
86
-
87
-
88
-
89
-
90
-
91
-
92
-
93
-
94
-
95
-
96
-
97
-
98
-
99
-
100
-
101
-
102
-
103
-
104
-
105
-
106
-
107
-
108
-
109
-
110
-
111
-
112
-
113
-
114
-
115
-
116
-
117
-
118
-
119
-
120
-
121
-
122
-
123
-
124
-
125
-
126
-
127
-
128
-
129
-
130
-
131
-
132
-
133
-
134
-
135
-
136
-
137
-
138
-
139
-
140
-
141
-
142
-
143
-
144
-
145
-
146
-
147
-
148
-
149
-
150
-
151
-
152
-
153
-
154
-
155
-
156
-
157
-
158
-
159
-
160
-
161
-
162
-
163
-
164
-
165
-
166
-
167
-
168
-
169
-
170
-
171
-
172
-
173
-
174
-
175
-
176
 |
 |
Table of Contents
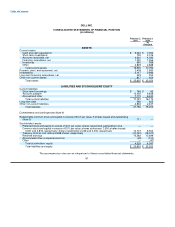
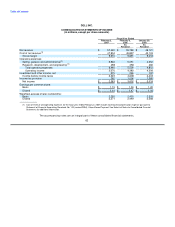
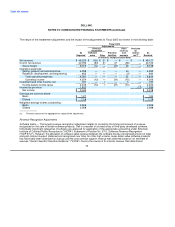
DELL, INC.
CONSOLIDATED STATEMENTS OF STOCKHOLDERS' EQUITY
(in millions)
Common Stock and
Capital in Excess of Accumulated
Par Value Other
Issued Treasury Stock Retained Comprehensive
Shares Amount Shares Amount Earnings Loss Other Total
Balances at January 30, 2004 (Reported) 2,721 $ 6,823 165 $ (6,539) $ 6,131 $ (83) $ (52) $ 6,280
Cumulative impact of restatement — — — — (52) 10 — (42)
Balances at January 30, 2004 (Restated) 2,721 6,823 165 (6,539) 6,079 (73) (52) 6,238
Net income — — — — 3,018 — — 3,018
Change in net unrealized loss on investments, net of taxes of $16 — — — — — (52) — (52)
Foreign currency translation adjustments — — — — — 1 — 1
Change in net unrealized loss on derivative instruments, net of taxes
of $21 — — — — — 46 — 46
Total comprehensive income 3,013
Stock issuances under employee plans, including tax benefits 48 1,372 — — — — — 1,372
Repurchases — — 119 (4,219) — — — (4,219)
Other — — — — — — 8 8
Balances at January 28, 2005 (Restated) 2,769 8,195 284 (10,758) 9,097 (78) (44) 6,412
Net income — — — — 3,602 — — 3,602
Change in net unrealized loss on investments, net of taxes of $1 — — — — — (24) — (24)
Foreign currency translation adjustments — — — — — (8) — (8)
Change in net unrealized loss on derivative instruments, net of taxes
of $4 — — — — — 9 — 9
Total comprehensive income 3,579
Stock issuances under employee plans, including tax benefits 49 1,308 — — — — — 1,308
Repurchases — — 204 (7,249) — — — (7,249)
Other — — — — — — (3) (3)
Balances at February 3, 2006 (Restated) 2,818 9,503 488 (18,007) 12,699 (101) (47) 4,047
Net income — — — — 2,583 — — 2,583
Change in net unrealized loss on investments, net of taxes of $12 — — — — — 31 — 31
Foreign currency translation adjustments — — — — — (11) — (11)
Change in net unrealized gain on derivative instruments, net of taxes
of $11 — — — — — 30 — 30
Valuation of retained interests in securitized assets, net of taxes of $7 — — — — — 23 — 23
Total comprehensive income — — — — — — — 2,656
Stock issuances under employee plans 14 196 — — — — — 196
Repurchases — — 118 (3,026) — — — (3,026)
Stock-based compensation expense under SFAS 123(R) — 368 — — — — — 368
Tax benefit from employee stock plans — 56 — — — — — 56
Other and shares issued to subsidiaries 475 (16) — — — — 47 31
Balances at February 2, 2007 3,307 $ 10,107 606 $(21,033) $15,282 $ (28) $ — $ 4,328
The accompanying notes are an integral part of these consolidated financial statements.
64