Dell 2006 Annual Report Download - page 24
Download and view the complete annual report
Please find page 24 of the 2006 Dell annual report below. You can navigate through the pages in the report by either clicking on the pages listed below, or by using the keyword search tool below to find specific information within the annual report.-
 1
1 -
2
-
3
-
4
-
5
-
6
-
7
-
8
-
9
-
10
-
11
-
12
-
13
-
 14
14 -
 15
15 -
 16
16 -
 17
17 -
 18
18 -
 19
19 -
 20
20 -
 21
21 -
 22
22 -
 23
23 -
 24
24 -
 25
25 -
 26
26 -
 27
27 -
 28
28 -
 29
29 -
 30
30 -
 31
31 -
 32
32 -
 33
33 -
 34
34 -
35
-
36
-
37
-
38
-
39
-
40
-
41
-
42
-
43
-
44
-
45
-
46
-
47
-
48
-
49
-
50
-
51
-
52
-
53
-
54
-
55
-
56
-
57
-
58
-
59
-
60
-
61
-
62
-
63
-
64
-
65
-
66
-
67
-
68
-
69
-
70
-
71
-
72
-
73
-
74
-
75
-
76
-
77
-
78
-
79
-
80
-
81
-
82
-
83
-
84
-
85
-
86
-
87
-
88
-
89
-
90
-
91
-
92
-
93
-
94
-
95
-
96
-
97
-
98
-
99
-
100
-
101
-
102
-
103
-
104
-
105
-
106
-
107
-
108
-
109
-
110
-
111
-
112
-
113
-
114
-
115
-
116
-
117
-
118
-
119
-
120
-
121
-
122
-
123
-
124
-
125
-
126
-
127
-
128
-
129
-
130
-
131
-
132
-
133
-
134
-
135
-
136
-
137
-
138
-
139
-
140
-
141
-
142
-
143
-
144
-
145
-
146
-
147
-
148
-
149
-
150
-
151
-
152
-
153
-
154
-
155
-
156
-
157
-
158
-
159
-
160
-
161
-
162
-
163
-
164
-
165
-
166
-
167
-
168
-
169
-
170
-
171
-
172
-
173
-
174
-
175
-
176
 |
 |
Table of Contents
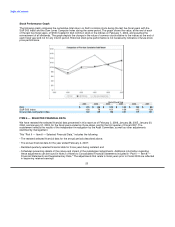
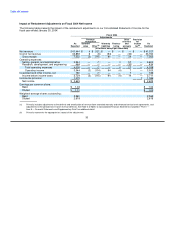
for Fiscal 2003. The cumulative impact of these adjusting entries increased retained earnings by $59 million, net of tax, at
the beginning of Fiscal 2003.
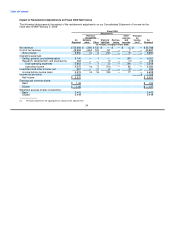
The following balance sheet data as of February 2, 2007 and February 3, 2006, and results of operations for the fiscal years
ended February 2, 2007, February 3, 2006 and January 28, 2005 are derived from our audited financial statements included
in "Part II — Item 8 — Financial Statements and Supplementary Data." The data for the remaining periods is derived from
our unaudited financial statements for the respective periods.
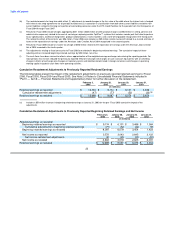
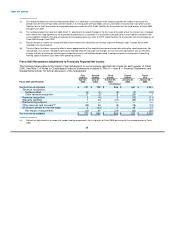
In addition to the adjustments described in Note 2 of Notes to Consolidated Financial Statements, there were errors and
irregularities identified with respect to certain restructuring charges that we recorded in the fourth quarter of Fiscal 2001 and
the second quarter of Fiscal 2002 that have been corrected in these selected financial data tables. It was determined that
components of certain charges were not approved and finalized in a timely fashion in order for them to be properly included
in the charges, certain items in the charges should have been accrued for in a different period, and in some cases, ineligible
items were included in the restructuring charges. Additionally, on some occasions, once excess restructuring charge
amounts were identified, the excess amounts were not released to the income statement in a timely fashion, or with
appropriate disclosures. The necessary adjustments to correct these errors and irregularities are included in the beginning
retained earnings adjustment and restatement adjustments.
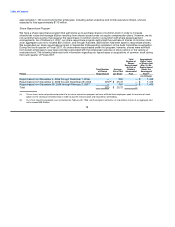
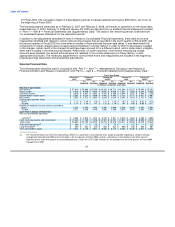
Selected Financial Data
The following table should be read in conjunction with "Part II — Item 7 — Management's Discussion and Analysis of
Financial Condition and Results of Operations" and "Part II — Item 8 — Financial Statements and Supplementary Data."
Fiscal Year Ended
February 2, February 3, January 28, January 30, January 31,
2007 2006(c) 2005(d) 2004 2003(e)
As As As As As As As As
Reported Restated Reported Restated Reported Restated Reported Restated
(in millions, except per share data)
Results of Operations:
Net revenue $ 57,420 $ 55,908 $ 55,788 $ 49,205 $ 49,121 $ 41,444 $ 41,327 $ 35,404 $ 35,262
Gross margin $ 9,516 $ 9,950 $ 9,891 $ 9,015 $ 9,018 $ 7,552 $ 7,563 $ 6,349 $ 6,438
Operating income $ 3,070 $ 4,347 $ 4,382 $ 4,254 $ 4,206 $ 3,544 $ 3,525 $ 2,844 $ 2,738
Income before income taxes $ 3,345 $ 4,574 $ 4,608 $ 4,445 $ 4,403 $ 3,724 $ 3,711 $ 3,027 $ 2,907
Net income $ 2,583 $ 3,572 $ 3,602 $ 3,043 $ 3,018 $ 2,645 $ 2,625 $ 2,122 $ 2,031
Earnings per common share:
Basic $ 1.15 $ 1.49 $ 1.50 $ 1.21 $ 1.20 $ 1.03 $ 1.02 $ 0.82 $ 0.79
Diluted $ 1.14 $ 1.46 $ 1.47 $ 1.18 $ 1.18 $ 1.01 $ 1.00 $ 0.80 $ 0.77
Number of weighted-average shares outstanding:
Basic 2,255 2,403 2,403 2,509 2,509 2,565 2,565 2,584 2,584
Diluted 2,271 2,449 2,449 2,568 2,568 2,619 2,619 2,644 2,644
Cash Flow & Balance Sheet Data:
Net cash provided by operating
activities(f) $ 3,969 $ 4,839 $ 4,751 $ 5,310 $ 5,821 $ 3,670 $ 4,064 $ 3,538 $ 3,908
Cash, cash equivalents and investments $ 12,445 $ 11,749 $ 11,756 $ 14,101 $ 14,101 $ 11,922 $ 11,921 $ 9,905 $ 9,910
Total assets $ 25,635 $ 23,109 $ 23,252 $ 23,215 $ 23,318 $ 19,311 $ 19,340 $ 15,470 $ 15,540
Short-term borrowings(a) $ 188 $ — $ 65 $ — $ 74 $ — $ 157 $ — $ 129
Long-term debt(b) $ 569 $ 504 $ 625 $ 505 $ 662 $ 505 $ 645 $ 506 $ 581
Total stockholders' equity $ 4,328 $ 4,129 $ 4,047 $ 6,485 $ 6,412 $ 6,280 $ 6,238 $ 4,873 $ 4,846
(a) The restated amounts for short-term borrowings reflect (1) a correction in classification from accounts payable regarding a vendor financing
arrangement during Fiscal 2002 until termination in the first quarter of Fiscal 2006, and (2) a correction in classification from other current
liabilities for the short-term portion of outstanding advances under the DFS Credit Facilities for the periods from the third quarter of Fiscal 2004
through Fiscal 2007.
21