Dell 2006 Annual Report Download - page 105
Download and view the complete annual report
Please find page 105 of the 2006 Dell annual report below. You can navigate through the pages in the report by either clicking on the pages listed below, or by using the keyword search tool below to find specific information within the annual report.-
 1
1 -
2
-
3
-
4
-
5
-
6
-
7
-
8
-
9
-
10
-
11
-
12
-
13
-
14
-
15
-
16
-
17
-
18
-
19
-
20
-
21
-
22
-
23
-
24
-
25
-
26
-
27
-
28
-
29
-
30
-
31
-
32
-
33
-
34
-
35
-
36
-
37
-
38
-
39
-
40
-
41
-
42
-
43
-
44
-
45
-
46
-
47
-
48
-
49
-
50
-
51
-
52
-
53
-
54
-
55
-
56
-
57
-
58
-
59
-
60
-
61
-
62
-
63
-
64
-
65
-
66
-
67
-
68
-
69
-
70
-
71
-
72
-
73
-
74
-
75
-
76
-
77
-
78
-
79
-
80
-
81
-
82
-
83
-
84
-
85
-
86
-
87
-
88
-
89
-
90
-
91
-
92
-
93
-
94
-
 95
95 -
 96
96 -
 97
97 -
 98
98 -
 99
99 -
 100
100 -
 101
101 -
 102
102 -
 103
103 -
 104
104 -
 105
105 -
 106
106 -
 107
107 -
 108
108 -
 109
109 -
 110
110 -
 111
111 -
 112
112 -
 113
113 -
 114
114 -
 115
115 -
116
-
117
-
118
-
119
-
120
-
121
-
122
-
123
-
124
-
125
-
126
-
127
-
128
-
129
-
130
-
131
-
132
-
133
-
134
-
135
-
136
-
137
-
138
-
139
-
140
-
141
-
142
-
143
-
144
-
145
-
146
-
147
-
148
-
149
-
150
-
151
-
152
-
153
-
154
-
155
-
156
-
157
-
158
-
159
-
160
-
161
-
162
-
163
-
164
-
165
-
166
-
167
-
168
-
169
-
170
-
171
-
172
-
173
-
174
-
175
-
176
 |
 |

Table of Contents
DELL INC.
NOTES TO CONSOLIDATED FINANCIAL STATEMENTS (continued)
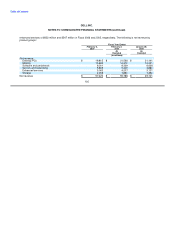
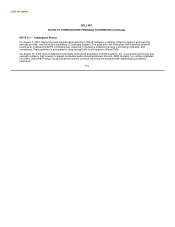
segments within the Americas. Corporate assets primarily include cash and cash equivalents, investments, deferred tax
assets, and other assets.
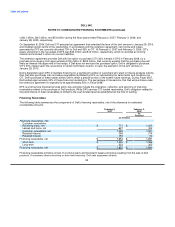
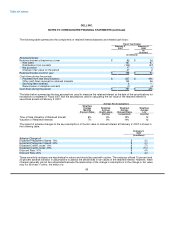
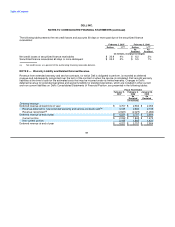
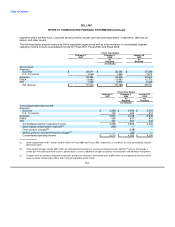
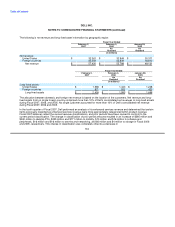
The following tables present revenue by Dell's reportable segments as well as a reconciliation of consolidated segment
operating income to Dell's consolidated income for Fiscal 2007, Fiscal 2006, and Fiscal 2005:
Fiscal Year Ended
February 2, February 3, January 28,
2007 2006 2005
As As
Restated Restated
(in millions)
Net revenue
Americas:
Business $ 29,311 $ 28,365 $ 25,289
U.S. Consumer 7,069 7,960 7,614
Americas 36,380 36,325 32,903
EMEA 13,682 12,887 10,753
APJ 7,358 6,576 5,465
Net revenue $ 57,420 $ 55,788 $ 49,121
Fiscal Year Ended
February 2, February 3, January 28,
2007 2006 2005
As As
Restated Restated
(in millions)
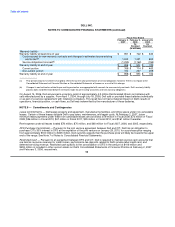
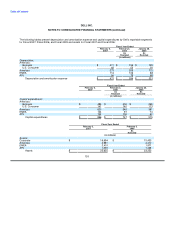
Consolidated operating income
Americas:
Business $ 2,388 $ 2,956 $ 2,534
U.S. Consumer 135 452 414
Americas 2,523 3,408 2,948
EMEA 583 871 815
APJ 332 524 443
Consolidated segment operating income 3,438 4,803 4,206
Stock-based compensation expense(a) (368) — —
Other product charges(b) — (338) —
Selling, general, and administrative charges(c) — (83) —
Consolidated operating income $ 3,070 $ 4,382 $ 4,206
(a) Stock compensation of $17 million and $18 million for Fiscal 2006 and Fiscal 2005, respectively, is included in the total consolidated segment
operating income.
(b) Other product charges include $307 million for estimated warranty costs of servicing or replacing certain OptiPlexTMsystems that include a
vendor part that failed to perform to Dell's specifications, as well as additional charges for product rationalizations and workforce realignment.
(c) Charges relate to workforce realignment expenses, primarily for severance and related costs of $50 million, cost of operating leases on office
space no longer utilized of $4 million, and a write-off of goodwill of $29 million.
102