DIRECTV 2007 Annual Report Download - page 97
Download and view the complete annual report
Please find page 97 of the 2007 DIRECTV annual report below. You can navigate through the pages in the report by either clicking on the pages listed below, or by using the keyword search tool below to find specific information within the annual report.-
 1
1 -
2
-
3
-
4
-
5
-
6
-
7
-
8
-
9
-
10
-
11
-
12
-
13
-
14
-
15
-
16
-
17
-
18
-
19
-
20
-
21
-
22
-
23
-
24
-
25
-
26
-
27
-
28
-
29
-
30
-
31
-
32
-
33
-
34
-
35
-
36
-
37
-
38
-
39
-
40
-
41
-
42
-
43
-
44
-
45
-
46
-
47
-
48
-
49
-
50
-
51
-
52
-
53
-
54
-
55
-
56
-
57
-
58
-
59
-
60
-
61
-
62
-
63
-
64
-
65
-
66
-
67
-
68
-
69
-
70
-
71
-
72
-
73
-
74
-
75
-
76
-
77
-
78
-
79
-
80
-
81
-
82
-
83
-
84
-
85
-
86
-
 87
87 -
 88
88 -
 89
89 -
 90
90 -
 91
91 -
 92
92 -
 93
93 -
 94
94 -
 95
95 -
 96
96 -
 97
97 -
 98
98 -
 99
99 -
 100
100 -
 101
101 -
 102
102 -
 103
103 -
 104
104 -
 105
105 -
 106
106 -
 107
107 -
108
-
109
-
110
-
111
-
112
-
113
-
114
-
115
-
116
-
117
-
118
-
119
-
120
-
121
-
122
-
123
-
124
-
125
-
126
-
127
-
128
-
129
-
130
-
131
-
132
-
133
-
134
-
135
 |
 |

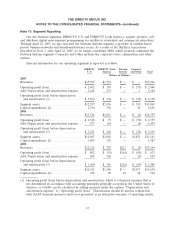
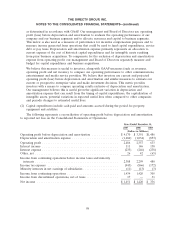
THE DIRECTV GROUP, INC.
NOTES TO THE CONSOLIDATED FINANCIAL STATEMENTS—(continued)
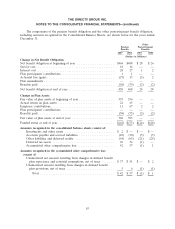
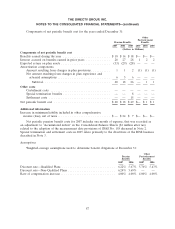
Weighted-average assumptions used to determine net periodic benefit cost for the years ended
December 31:
Other Postretirement
Pension Benefits Benefits
2007 2006 2005 2007 2006 2005
Discount rate—Qualified Plan ................... 5.67% 5.78% 6.00% 5.43% 5.46% 5.75%
Discount rate—Non-Qualified Plans ............... 5.69% 5.74% 6.00% — — —
Expected long-term return on plan assets ........... 8.75% 8.75% 9.00% — — —
Rate of compensation increase ................... 4.00% 4.00% 4.00% 4.00% 4.00% 4.00%
We base our expected long-term return on plan assets assumption on a periodic review and
modeling of the plans’ asset allocation and liability structure over a long-term horizon. Expectations of
returns for each asset class are the most important of the assumptions used in the review and modeling
and are based on comprehensive reviews of historical data and economic/financial market theory.
A hypothetical 0.25% decrease in our discount rate would have had the effect of increasing our
2007 pension expense by approximately $1 million and our projected benefit obligation by
approximately $13 million. A hypothetical 0.25% decrease in our expected return on plan assets would
have had the effect of increasing our 2007 pension expense by approximately $1 million.
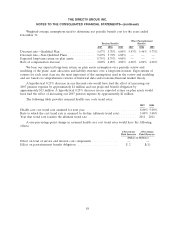
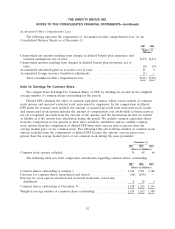
The following table provides assumed health care costs trend rates:
2007 2006
Health care cost trend rate assumed for next year ............................. 8.00% 9.00%
Rate to which the cost trend rate is assumed to decline (ultimate trend rate) ......... 5.00% 5.00%
Year that trend rate reaches the ultimate trend rate ........................... 2011 2011
A one-percentage-point change in assumed health care cost trend rates would have the following
effects:
1-Percentage 1-Percentage
Point Increase Point Decrease
(Dollars in Millions)
Effect on total of service and interest cost components ............... — —
Effect on postretirement benefit obligation ....................... $ 2 $(1)
88